Bar Graph in PHP and MySQL Free Source code and Tutorial
Introduction
Table of Contents
What is a bar graph?
A bar graph is a graphical representation of data, usually in the form of bars of different heights. The data can be displayed horizontally or vertically. The bars can be either solid or shaded. The purpose of a bar graph is to compare data between different categories.
When it comes to data, there are two main formats: graphical and tabular. Each has its own strengths and weaknesses, and it’s important to understand the differences between them so that you can choose the most appropriate format for your data.
Tabular data is the most common type of data. It’s easy to read and understand, and it can be easily sorted and filtered. However, tabular data is less visual than graphical data, which can make it difficult to understand.
Graphical data is more visually appealing than tabular data. It can be more informative because it shows relationships between variables in a way that’s easy to understand.
Objectives
By the end of this tutorial, you will be able to:
- Create a PHP script that connects to MySQL database to create a dynamic bar graph.
- Use chart.js to create the bar graph
- To integrate and apply the source code in your projects
Relevant Source code
In this tutorial, we will learn how to create a bar graph in PHP and MySQL. We will be using the Chart.js library to create the graph.
The following are the requirements for this tutorial:
- XAMPP
- Text editor (VS Code, Sublime, Brackets), download and install a text editor of your choice
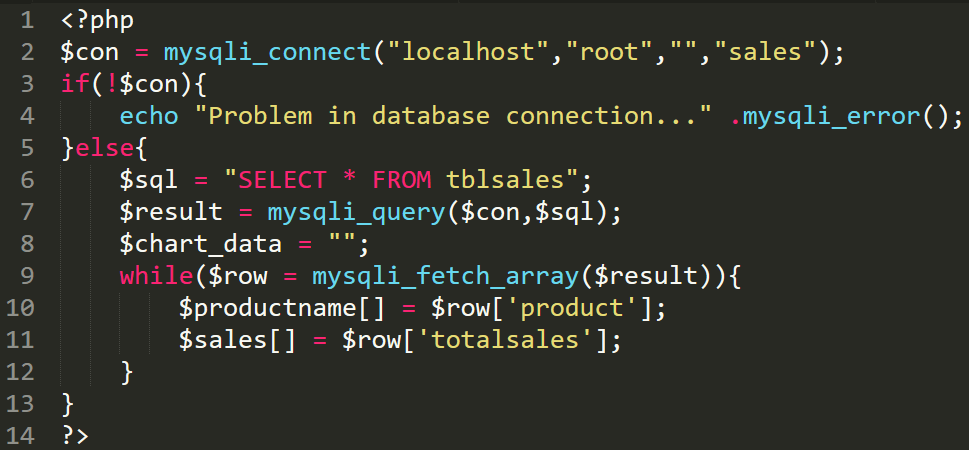
Line 1-14 – this is the PHP script that will connect to our database and select the table for us to create a dynamic bar graph.
The name of our database is sales and it has a table named tblsales. If you are using XAMPP, please don’t forget to check that the Apache and MySQL are running.
<?php
$con = mysqli_connect("localhost","root","","sales");
if(!$con){
echo "Problem in database connection..." .mysqli_error();
}else{
$sql = "SELECT * FROM tblsales";
$result = mysqli_query($con,$sql);
$chart_data = "";
while($row = mysqli_fetch_array($result)){
$productname[] = $row['product'];
$sales[] = $row['totalsales'];
}
}
?>
Create table SQL
-- Table structure for table `tblsales`
--

CREATE TABLE `tblsales` (
`id` int(11) NOT NULL,
`product` varchar(100) NOT NULL,
`totalsales` double NOT NULL
) ENGINE=InnoDB DEFAULT CHARSET=utf8mb4;

--
-- Dumping data for table `tblsales`
--

INSERT INTO `tblsales` (`id`, `product`, `totalsales`) VALUES
(1, 'product 1', 167),
(2, 'product 2', 178),
(3, 'product 3', 198);
Chart.js
<script src=”//cdnjs.cloudflare.com/ajax/libs/Chart.js/2.4.0/Chart.min.js”></script> – include this line to use the functionality of the library.
Chart.js is a free, open-source JavaScript library for data visualization, which supports eight chart types: bar, line, area, pie, bubble, radar, polar, and scatter.
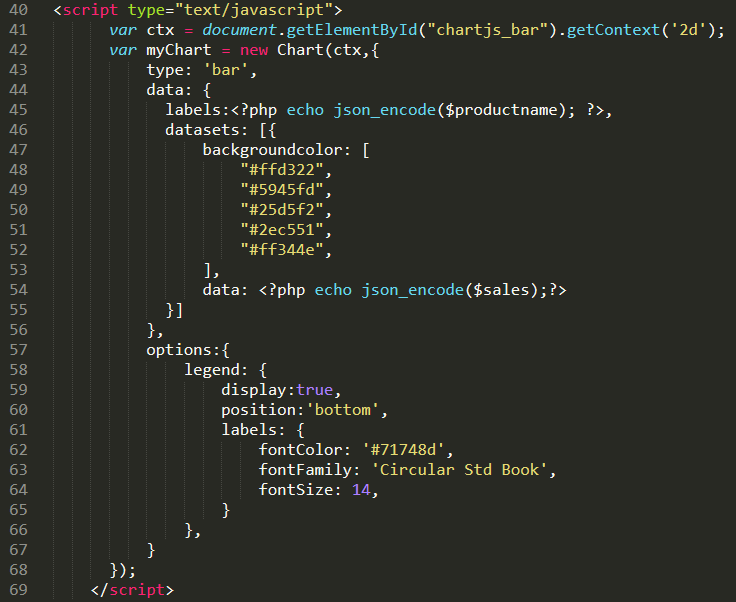
The code below is the sample code on how to create a bar graph using chart.js. Please refer to the official documentation of the Chart.js Library
<script type="text/javascript">
var ctx = document.getElementById("chartjs_bar").getContext('2d');
var myChart = new Chart(ctx,{
type: 'bar',
data: {
labels:<?php echo json_encode($productname); ?>,
datasets: [{
backgroundcolor: [
"#ffd322",
"#5945fd",
"#25d5f2",
"#2ec551",
"#ff344e",
],
data: <?php echo json_encode($sales);?>
}]
},
options:{
legend: {
display:true,
position:'bottom',
labels: {
fontColor: '#71748d',
fontFamily: 'Circular Std Book',
fontSize: 14,
}
},
}
});
</script>
Video Demo
Summary
Bar graphs are useful because they allow you to compare different data sets. They can be used to compare the size of two or more data sets, their proportions, or the size change of two or more data sets over time. Furthermore, bar graphs are simple to comprehend and can be utilized to convey information quickly and effectively.
In this article, you can download the source code and as well as the database used in creating the bar graph. For the complete reference please watch the video presentation on how to create the bar graph in PHP, MySQL and Chart.js
We hope you found this tutorial to be helpful! Wishing you the best of luck with your projects! Happy Coding!
You may visit our Facebook page for more information, inquiries, and comments. Please subscribe also to our YouTube Channel to receive free capstone projects resources and computer programming tutorials.
Hire our team to do the project.
Related Topics and Articles:
How to Generate Random Password in PHP Free Source code and Tutorial
Email Validation in PHP Free Source code and Tutorial
Law Office Management Information System in Bootstrap and PHP Script
QR Code Generator in PHP Free Source code and Tutorial
Cloud-Based Farm Management Assistant System Free Bootstrap Source code