Faculty Evaluation System ER Diagram
This article will walk you through the process of creating an entity relationship diagram, also known as an ERD, for the project entitled Faculty Evaluation System, from start to finish step by step.
Description of the Project
When instructors want to get feedback from students regarding their course and teaching, they can use an online faculty evaluation system. Students can submit ratings and comments regarding the course, the instructor, and the teaching methods through the system’s rating and commenting system. Instructors can use the information gathered to make improvements to their courses and teaching methods. The advantages of a teacher assessment system that is accessible online
Feedback allows educators to evaluate their own performance and make improvements to their teaching methods by collecting it. It also provides children with an opportunity to express themselves, which can be particularly valuable if they are concerned about anything. Because the data collected is generally anonymous, each student is free to express his or her actual feelings without fear of embarrassment or retaliation from others.
Instructors can use the information gathered to improve their courses and teaching methods, resulting in students receiving a higher-quality education as a result of the data collection. As well, students have the opportunity to submit constructive criticism regarding the performance of instructors, which allows them to be evaluated fairly.
When using student evaluations of their courses as a tool to enhance and improve their teaching methods, it is critical that faculty members are aware of the possibility for bias in the data collected. Gender and ethnicity of the instructor, as well as the students’ grade point average, can all have an impact on student opinions of their instructors.
for more information about the system, you may visit the link below:
Faculty Evaluation System ERD
The first phase in the development of the Faculty Evaluation System is the preparation of the ER diagram, which will later be used as the basis for the creation of the actual database that will be used in the system.
We will develop an entity relationship diagram for the Faculty Evaluation System and describe the steps involved in creating the diagram.
Let us begin with the symbols that are used in the ER Diagram.
The rectangle shape represents the entity being represented. Later on, we will use this entity to create a database table for our Faculty Evaluation System.
The oval form represents the attribute being represented. The Faculty Evaluation System will have columns or fields for each table, and this will be the case.
The diamond shape represents the nature of a relationship. The relationships between entities will be determined by this. This is often accomplished through the use of a primary key to foreign key relationship.
We will follow the 3 basic rules in creating the ER Diagram.
- Identify all the entities.
- Identify the relationship between entities and
- Add meaningful attributes to our entities.
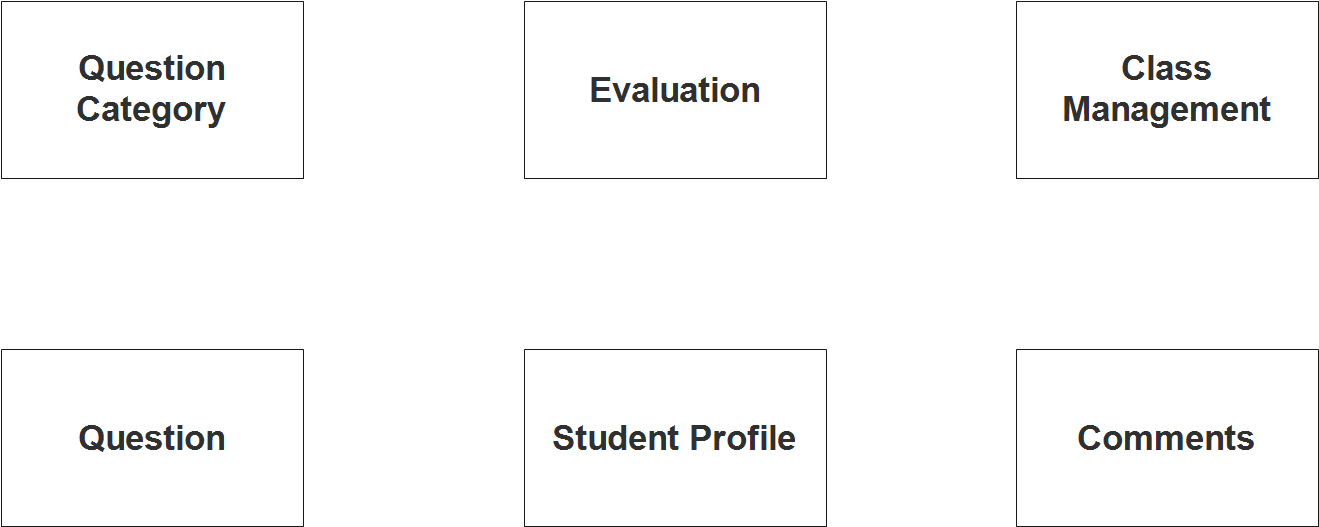
Step 1. In the Faculty Evaluation System we have the following entities:
- Student Profile
- Class Management
- Question Bank
- Question Category
- Evaluation
- Comments
The Faculty Evaluation System is comprised of six components, according to our design. When we design and develop the Faculty Evaluation System database schema, the components that make up these elements will be the segments of our database tables.
We will now draw the components of the Faculty Evaluation System in the shape of a rectangle, which will represent the system as a whole. The entities identified as operating under the scope of the Faculty Evaluation System are depicted in the graphic below.
Step 2. After we have specified our entities, it is time now to connect or establish a relationship among the entities.
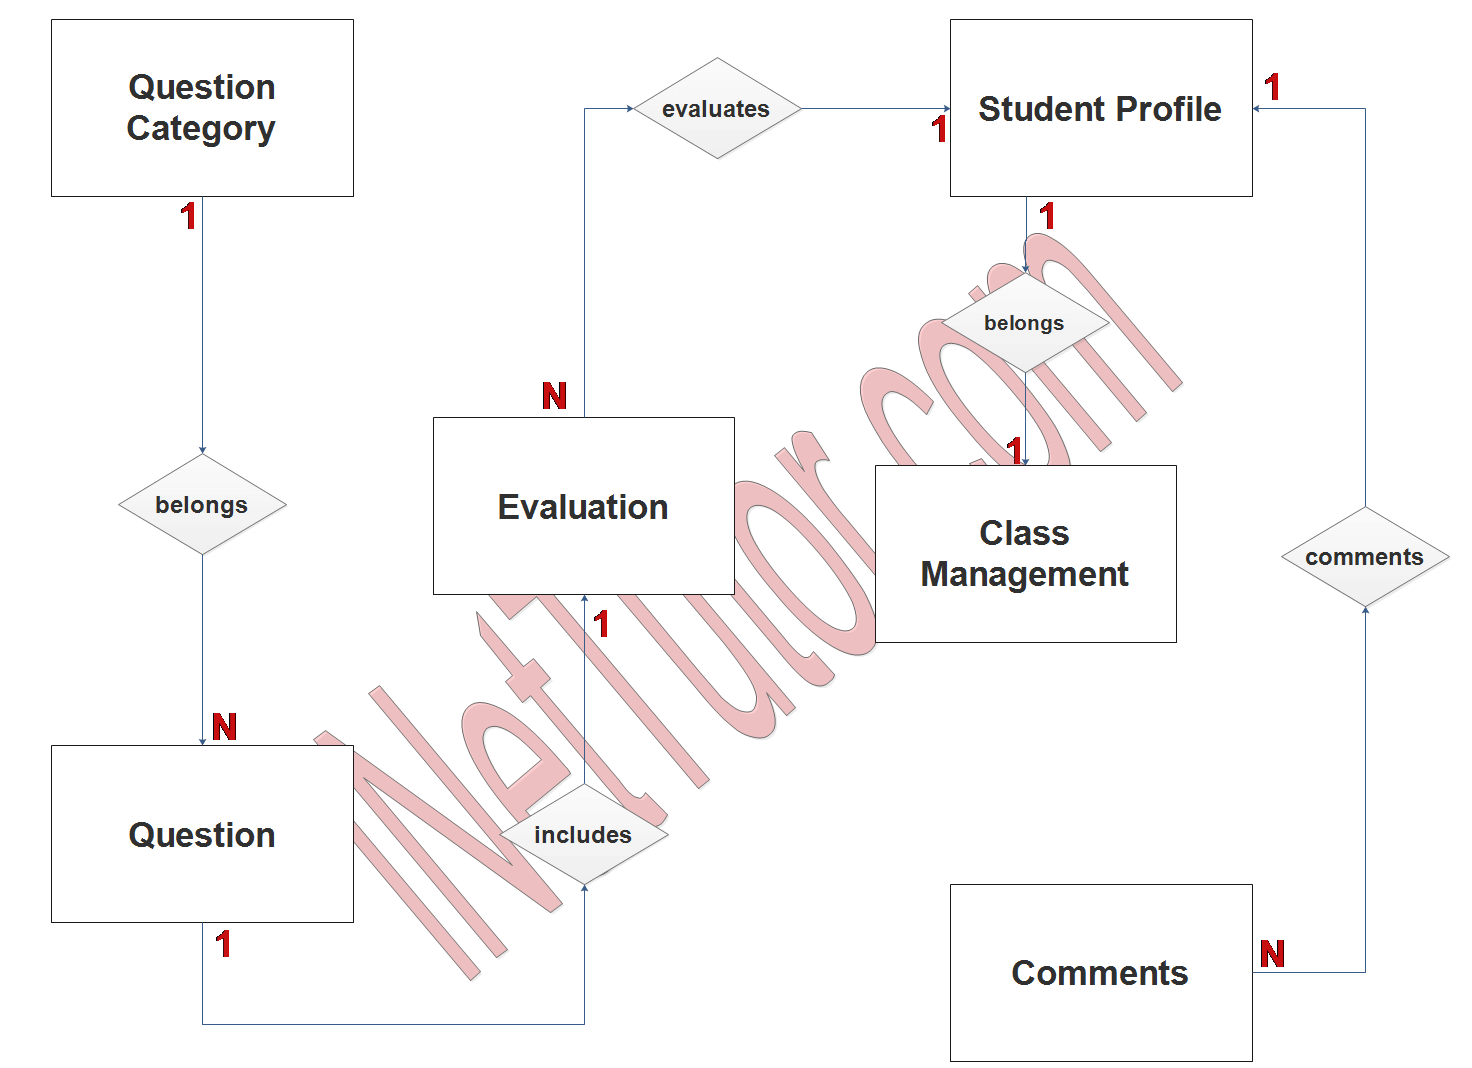
- A category is applicable to multiple question information (1 to many relationship).
- A question belongs only to one evaluation period (1 to 1 relationship).
- The student can only be a part of one class (1 to 1 relationship).
- The student can rate or evaluation multiple teachers or faculty, it will depend on how many subjects the student has (1 to many relationship).
- The student can also give feedback or comments to the faculty (1 to many relationship).
Step 3. The last part of the ERD process is to add attributes to our entities.
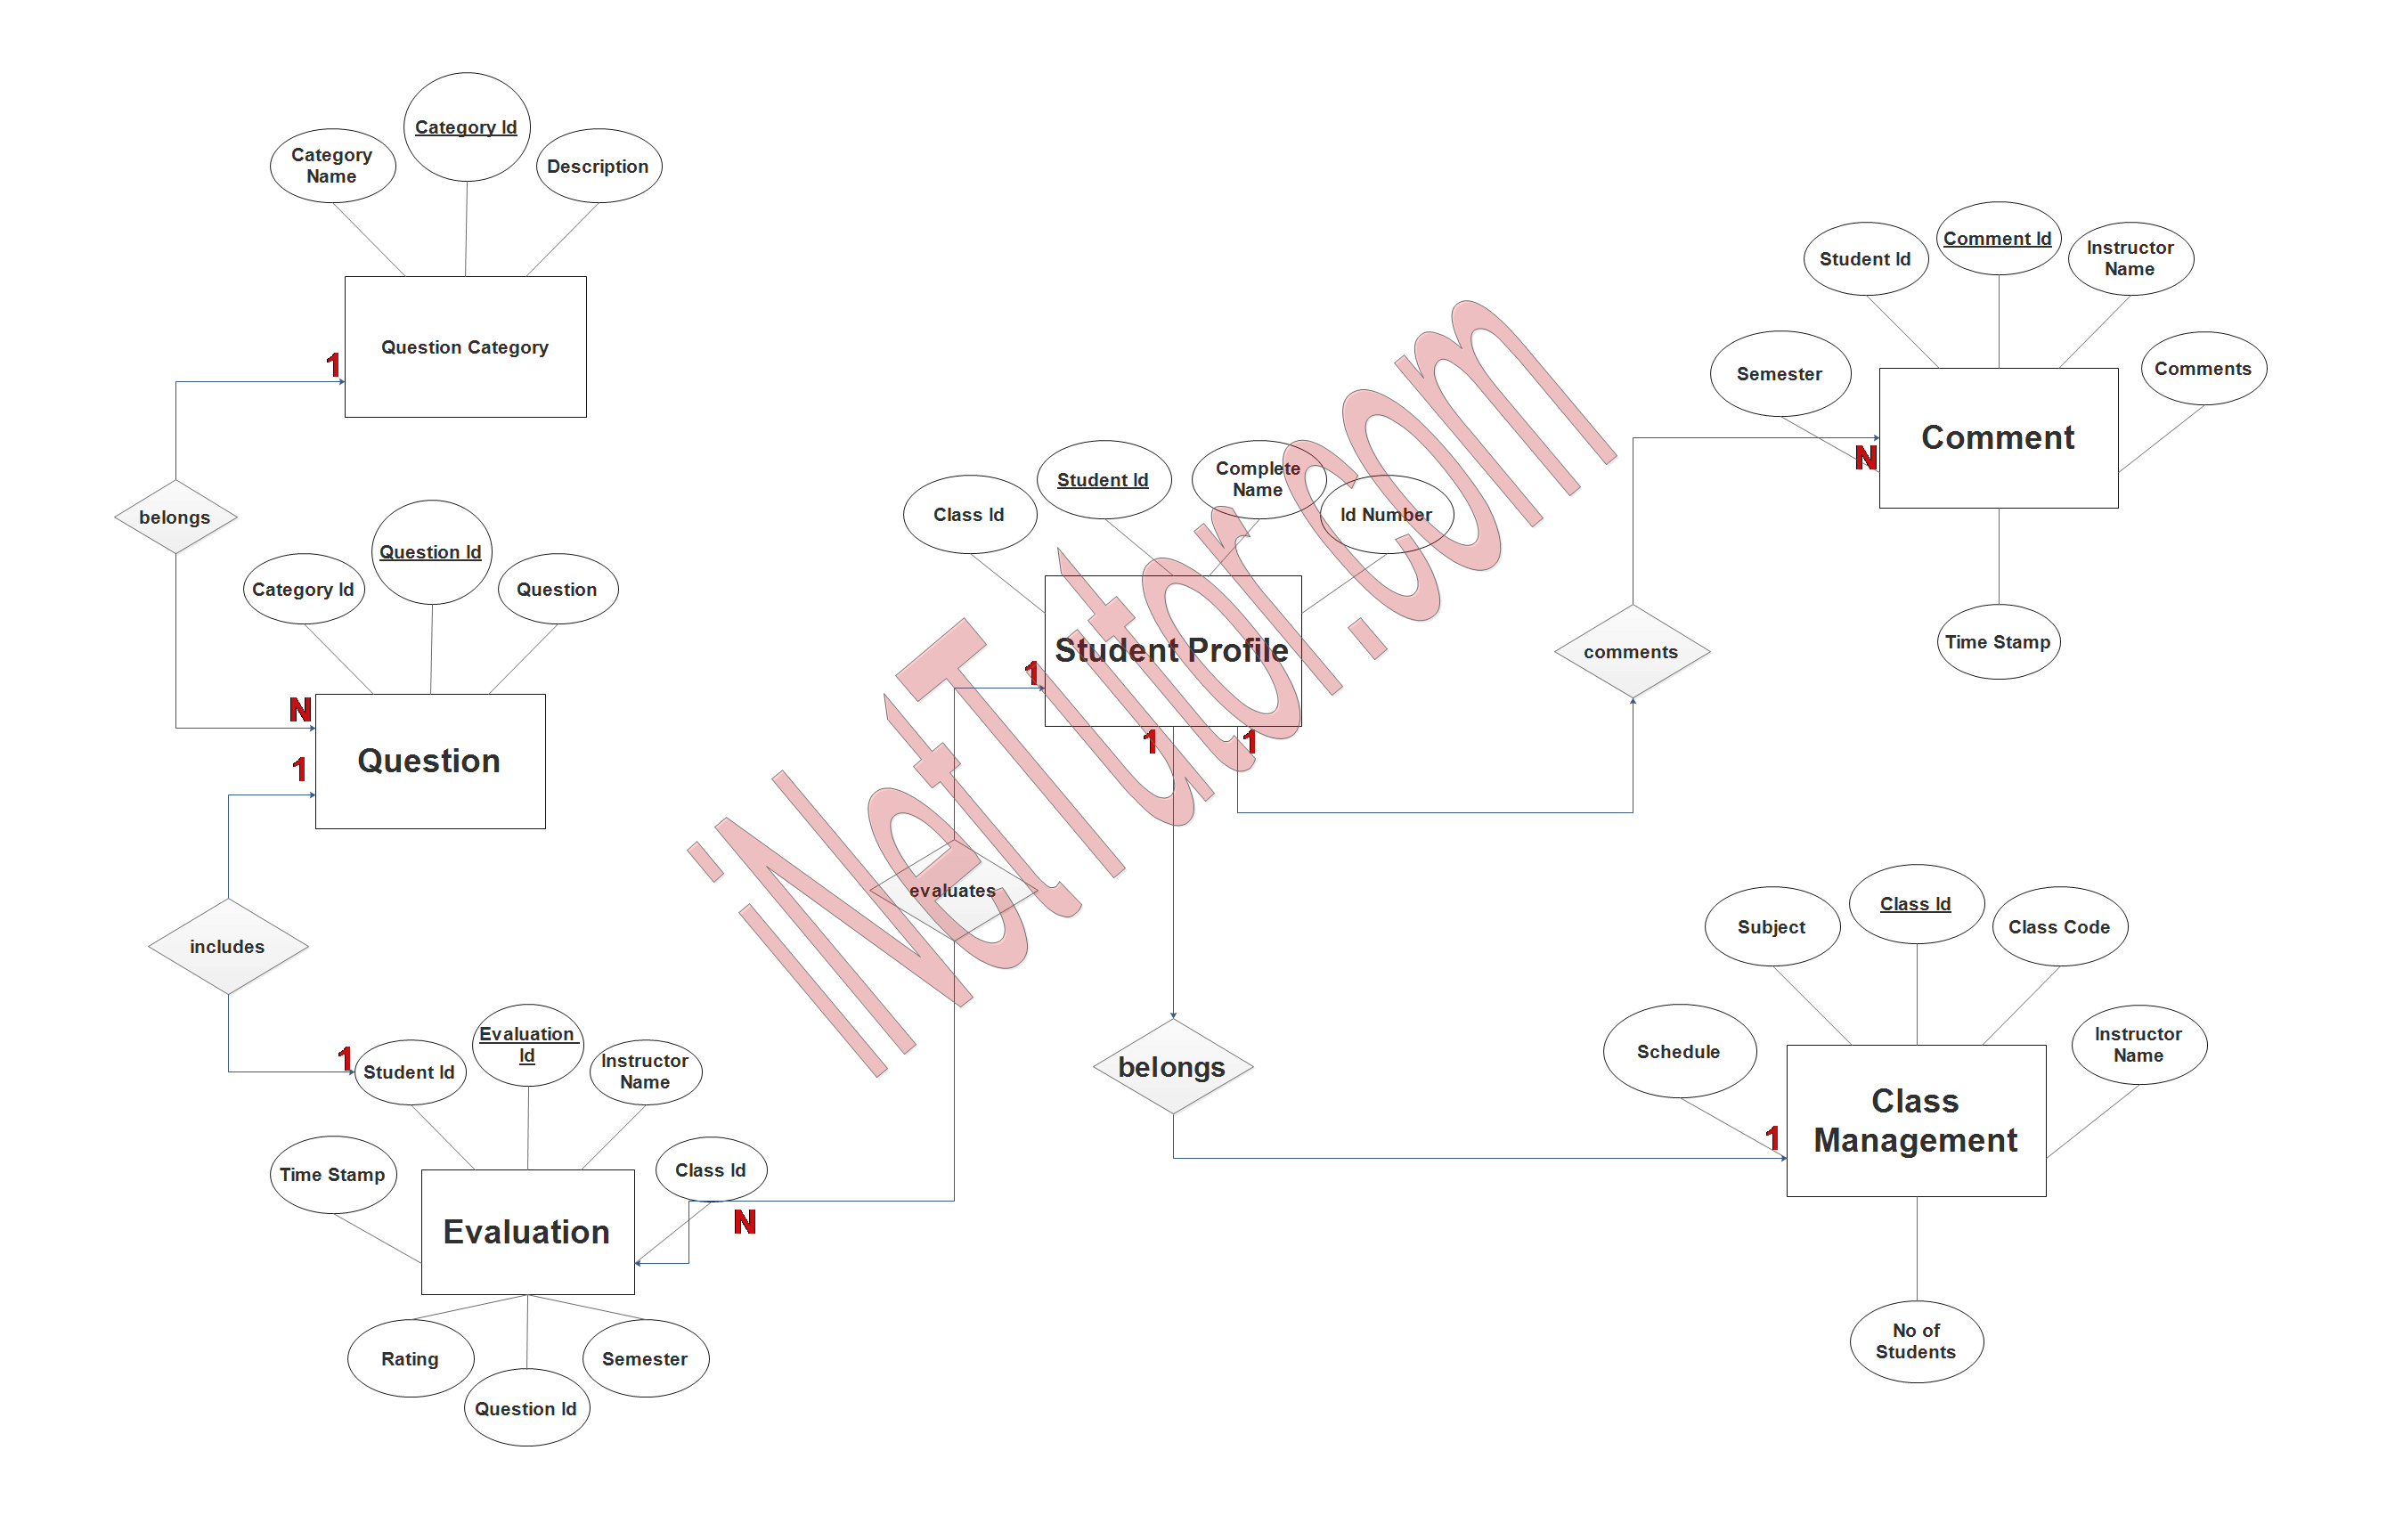
Student Profile
- Student ID – primary key represented with underline
- Complete name
- ID number
- Class ID – foreign key
Class Management
- Class ID – primary key represented with underline
- Class code
- Instructor name
- Subject
- Schedule
- No of students
Question Bank
- Question ID – primary key represented with underline
- Category ID – foreign key
- Question
Question Category
- Category ID – primary key represented with underline
- Category name
- Description
Evaluation
- Instructor ID – primary key represented with underline
- Instructor name
- Class ID – foreign key
- Semester
- Question ID – foreign key
- Rating
- Time stamp
- Student ID – foreign key
Comments
- Comment id – primary key represented with underline
- Instructor name
- Comments
- Student ID
- Semester
- Time stamp
Summary
In a database, an Entity Relationship Diagram (ERD) is a diagram that displays the various entities (tables) and how they are connected to one another, as well as how many instances of each kind there are. For example, one-to-one, one-to-many, many-to-many, and so on.
In order for the developers to design the real database for the project, they will use the ER Diagram as a guide and as a source of reference. If you have learned anything from our article on how to develop and construct an ER Diagram for Faculty Evaluation System, please share it with others.
You may visit our Facebook page for more information, inquiries, and comments. Please subscribe also to our YouTube Channel to receive free capstone projects resources and computer programming tutorials.
Hire our team to do the project.
Related Links and Articles:
Faculty Evaluation System Database Design Tutorial
IPO Model Conceptual Framework of Faculty Evaluation System
Sales and Inventory System ER Diagram