Sales and Inventory System ER Diagram
This article will discuss the step by step process on how to prepare the entity relationship diagram or ERD of the project entitled Sales and Inventory System ER Diagram.
The capstone project entitled Sales and Inventory System is a database system that organizes and manages the sales transactions as well as the inventory of stocks, products or items.
Related articles on the capstone project Sales and Inventory System ER Diagram
- Sales and Inventory System in Visual Basic .Net
- Furniture Sales and Inventory System User Interface and Features
- Sales and Inventory System Database Design
- Sales and Inventory with Decision Support System in PHP and MySQL
The first step in the development of the Sales and Inventory System ER Diagram is to prepare the ER diagram that will serve as the basis later on in the creation of the actual database.
We will create and explain the process of making the entity relationship diagram of Sales and Inventory System ER Diagram.
Let’s start from the symbols used in the ER Diagram.
Entity is represented by the rectangle shape. The entity will be our database table of Sales and Inventory System ER Diagram later on.
Attribute is represented by the oval shape. This will be the columns or fields of each table in the Sales and Inventory System ER Diagram.
Relationship is represented by diamond shape. This will determine the relationships among entities. This is usually in a form of primary key to foreign key connection.
We will follow the 3 basic rules in creating the ER Diagram.
- Identify all the entities.
- Identify the relationship between entities and
- Add meaningful attributes to our entities.
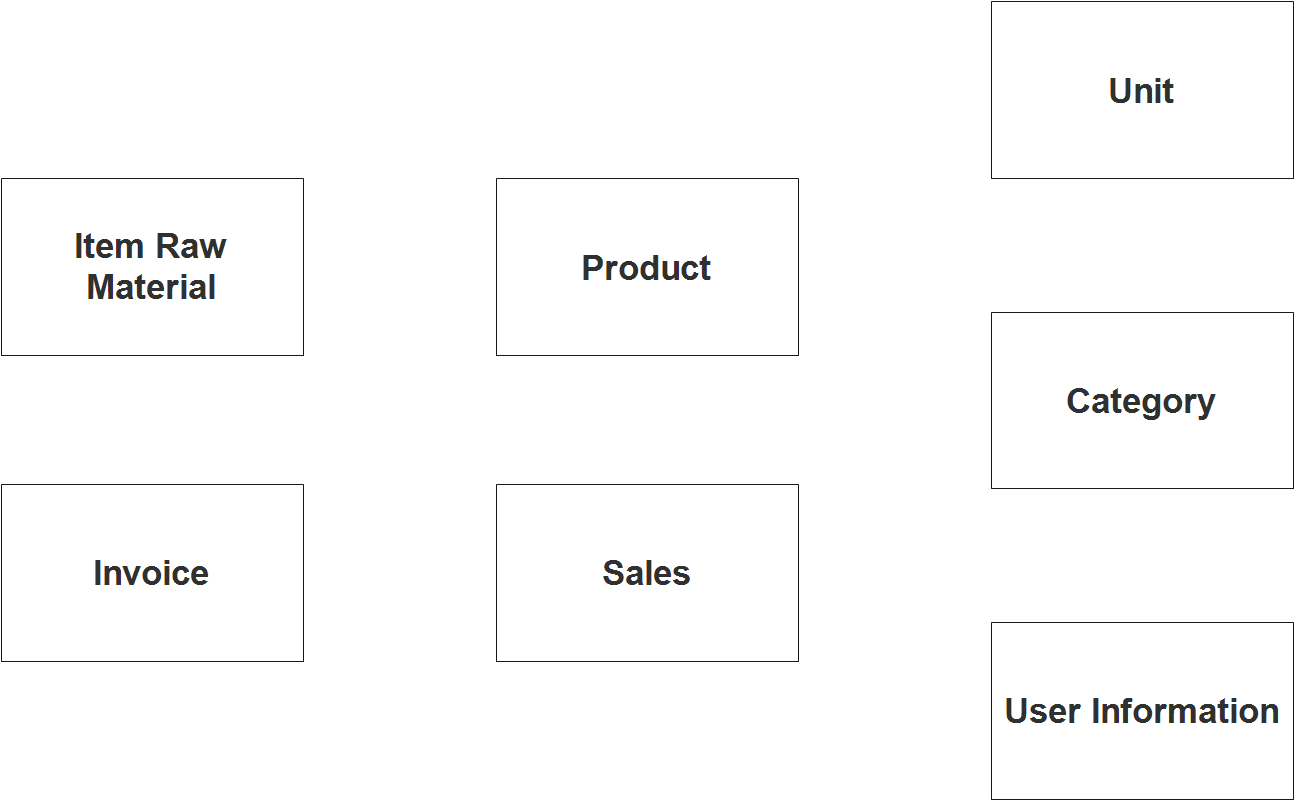
Step 1. In the Sales and Inventory System ER Diagram we have the following entities
- User Information
- Product
- Item Raw Material
- Unit
- Category
- Sales
- Invoice
Our design of Sales and Inventory System ER Diagram consists of 7 entities; the specified entities will be our database tables in the design and implementation of Sales and Inventory System ER Diagram database schema.
We will now draw the entities of the Sales and Inventory System ER Diagram specified above and it will be represented by a rectangle shape. The image below is the entities identified in the scope of the Sales and Inventory System ER Diagram.
Step 2. After we have specified our entities, it is time now to connect or establish a relationship among the entities.
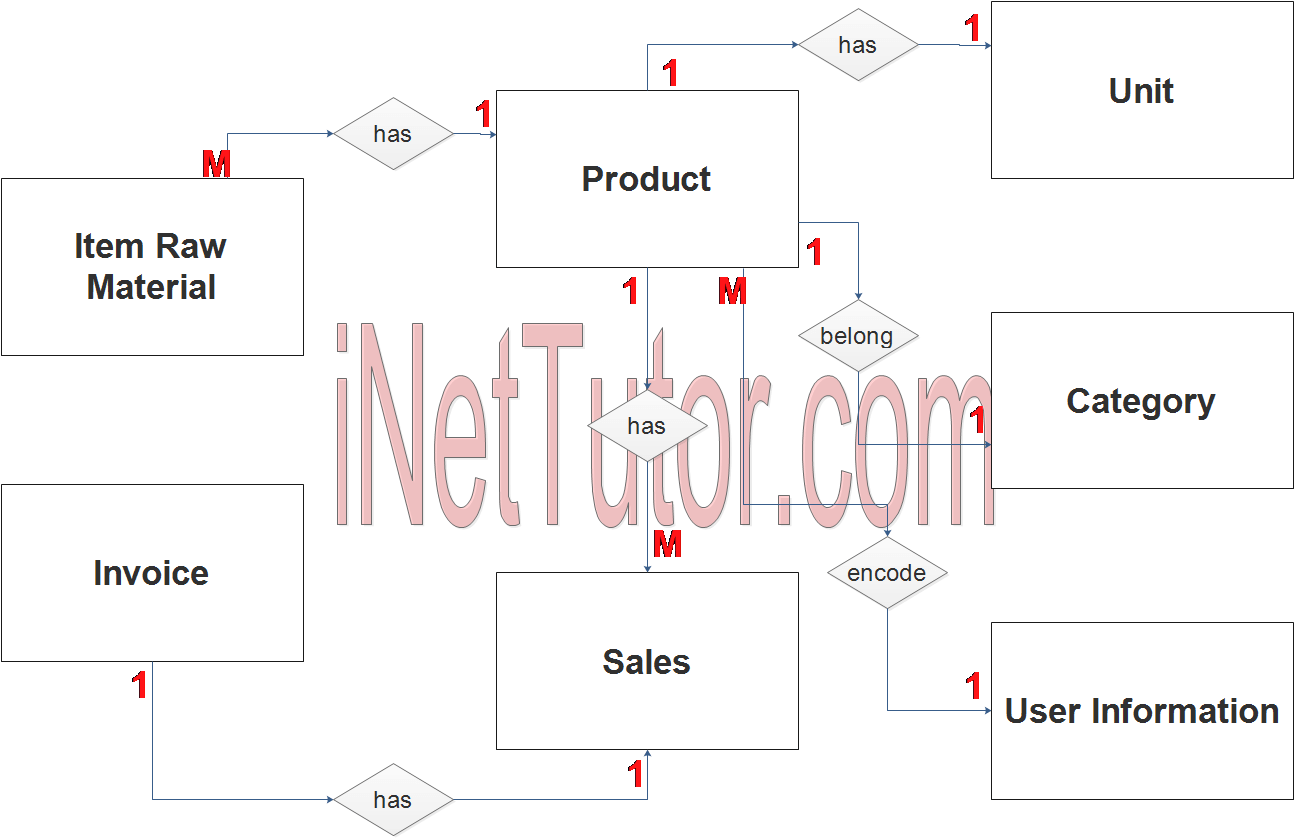
- The user encode/manage/update the product information (1 to many relationship). The user type that can manage the customer info is admin and encoder the type.
- The user encode/manage/update the unt information (1 to many relationship). The user type that can manage the customer info is the admin and encoder type.
- The user encode/manage/update the product category information (1 to many relationship). The user type that can manage the customer info is the admin and encoder type.
- The user encode/manage/update the item raw material information (1 to many relationship). The user type that can manage the customer info is the admin and encoder type.
- The product can contain 1 or ore raw materials (1 to many relationship).
- Product information may have 1 or more unit, for example, the product may be sold in piece, dozen, box, etc. (1 to many relationship).
- A product belongs to a specific category (1 to 1 relationship).
- Sale transactions includes 1 or more products (1 to many relationship). The user type that can manage the customer info is admin and cashier the type.
Step 3. The last part of the ERD process is to add attributes to our entities.
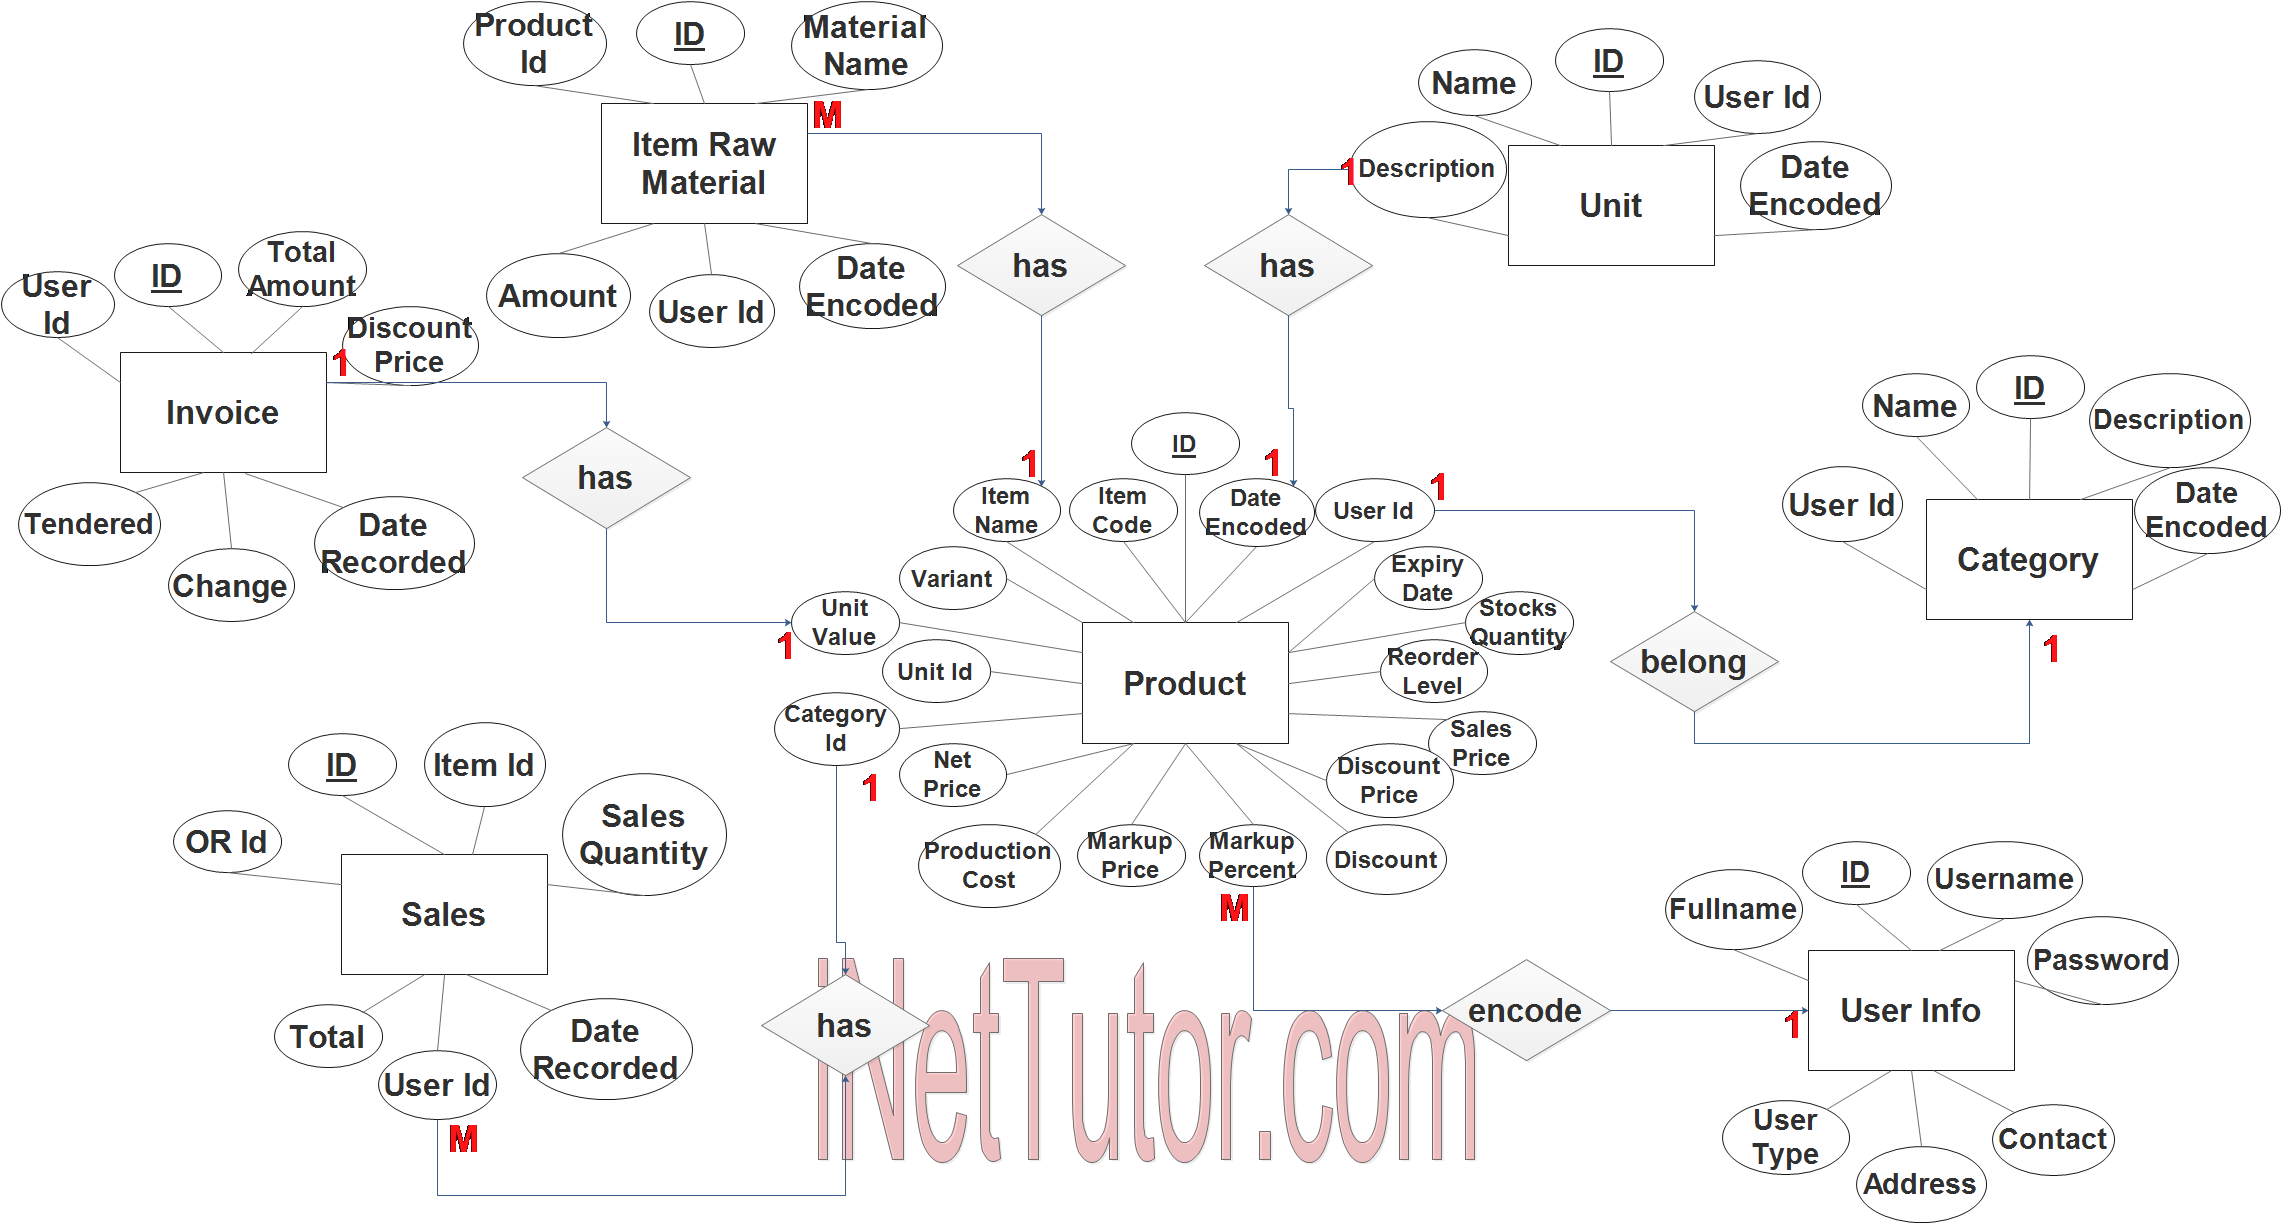
User Information Entity has the following attributes:
- ID – primary key represented with underline
- Fullname
- Contact
- Address
- Username
- Password
- User Type
Product Entity has the following attributes:
- ID – primary key represented with underline
- Item Code
- Item Name
- Variant
- Unit Value
- Unit ID – foreign key
- Category ID –foreign key
- Net Price
- Production Cost
- Markup Price
- Markup Percent
- Discount
- Discount Price
- Sales Price
- Reorder Level
- Stocks Quantity
- Expiry Date
- User ID – foreign key
- Date Encoded
Item Raw Material Entity has the following attributes:
- ID – primary key represented with underline
- Product ID –foreign name
- Material Name
- Amount
- Date Encoded
- User ID – foreign key
Unit Entity has the following attributes:
- ID – primary key represented with underline
- Name
- Description
- User ID – foreign key
- Date Encoded
Category Entity has the following attributes:
- ID – primary key represented with underline
- Name
- Description
- User ID – foreign key
- Date Encoded
Sales Entity has the following attributes:
- ID – primary key represented with underline
- Item ID – foreign key
- OR ID
- Sales Quantity
- Total
- User ID
- Date Recorded
Invoice Entity has the following attributes:
- ID – primary key represented with underline
- User ID
- Total Amount
- Discount Price
- Tendered
- Change
- Date Recorded
Note: all attributes with underline represents the primary key of the entity or table.
The next step is to convert the plan designed on ER Diagram into the actual database, please search for the Sales and Inventory System ER Diagram article which was already posted.
Contact us on our facebook page for the softcopy of the Sales and Inventory System ER Diagram.
You may visit our facebook page for more information, inquiries and comments.
Hire our team to do the project.