Student Performance Tracking ER Diagram
This article will discuss the step-by-step process on how to prepare the entity relationship diagram or ERD of the project entitled Student Performance Tracking.
About the Project
Table of Contents
The capstone project entitled “Student Performance Tracking” allows academic institutions to monitor and gather data about the academic performance of students where decisions are derived to further improve the students learning outcomes.
The student performance tracking system is a powerful and intuitive platform designed to help educators and parents monitor and improve student academic performance. With this system, you can easily track student scores and grades, set goals, and monitor progress over time. The system integrates with a variety of data sources, including student records, subject and course information, and grade level information, to provide a comprehensive view of student performance. The user-friendly interface makes it simple to access the information you need, and the flexible reporting features allow you to create customized reports to suit your specific needs. Whether you’re an educator, parent, or student, the student performance tracking system is a valuable tool for supporting academic success and improving student outcomes.
ER Diagram
The first step in the development of the Student Performance Tracking is to prepare the ER diagram that will serve as the basis later on in the creation of the actual database.
We will create and explain the process of making the entity relationship diagram of Student Performance Tracking.
Let’s start from the symbols used in the ER Diagram.
Entity is represented by the rectangle shape. The entity will be our database table of Student Performance Tracking later on.
Attribute is represented by the oval shape. This will be the columns or fields of each table in the Student Performance Tracking.
Relationship is represented by diamond shape. This will determine the relationships among entities. This is usually in a form of primary key to foreign key connection.
We will follow the 3 basic rules in creating the ER Diagram.
- Identify all the entities.
- Identify the relationship between entities and
- Add meaningful attributes to our entities.
Step 1. Identify Entities
In the Student Performance Tracking we have the following entities:
- Student
- Student Score
- Subject
- Grade Level
- Criteria
- Term
- User
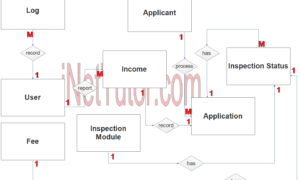
We will now draw the entities of the Student Performance Tracking specified above and it will be represented by a rectangle shape. The image below are the entities identified in the scope of the Student Academic Performance Tracking and Monitoring.
Step 2. Establish Relationships
After we have specified our entities, it is time now to connect or establish a relationship among the entities.
- user_id encodes tbl_student.user_id (1:N) – This relationship indicates that each user can be associated with multiple students, it means that the user can encode or process multiple student record or information. This is a one-to-many (1:N) relationship, where tbl_user.user_id is the primary key and tbl_student.user_id is the foreign key.
- student_id has tbl_student_score.student_id (1:N) – This relationship indicates that each student can have multiple scores, which indicates that the students may take test or exam and record the scores in the student score table. This is also a one-to-many (1:N) relationship, where tbl_student.student_id is the primary key and tbl_student_score.student_id is the foreign key.
- subject_id is included tbl_student_score.subject_id (1:N) – This relationship indicates that the subject id may appear more than once in the tbl_student_score table. This is also a one-to-many (1:N) relationship, where tbl_subject.subject_id is the primary key and tbl_student_score.subject_id is the foreign key.
- level_id is included tbl_student_score.level_id (1:N) – This relationship indicates that the level_id may appear more than once in the tbl_student_score table. This is also a one-to-many (1:N) relationship, where tbl_grade_level.level_id is the primary key and tbl_student_score.level_id is the foreign key.
- criteria_id is included tbl_student_score.criteria_id (1:N) – This relationship indicates that criteria_id may appear more than once in the tbl_student_score table. This is also a one-to-many (1:N) relationship, where tbl_criteria.criteria_id is the primary key and tbl_student_score.criteria_id is the foreign key.
- term_id is included tbl tbl_student_score.term_id (1:N) – This relationship indicates that the term_id can be stored or saved in the tbl_student_score table for more than one record. This is also a one-to-many (1:N) relationship, where tbl_term.term_id is the primary key and tbl_student_score.term_id is the foreign key.
Step 3. Add Meaningful Attributes
The last part of the ERD process is to add attributes to our entities.
Student entity has the following attributes:
- Student_id – Primary Key
- Id_number
- Last_name
- First_Name
- Middle_name
- Date_of_birth
- Complete_address
- Contact
- Email_address
- Profile_picture
- Username
- Password
- Account_status
- User_id
Student_score entity has the following attributes:
- Score_id – primary key
- Student_id – foreign key
- Subject_id – foreign key
- Level_id – foreign key
- Criteria_id – foreign key
- Term_id – foreign key
- Score
- Remarks
Subject entity has the following attributes:
- Subject_id – primary key
- Subject_code
- Subject_name
- Description
Grade-level entity has the following attributes:
- Level_id – primary key
- Level_name
Criteria entity has the following attributes:
- Criteria_id – primary key
- Criteria_name
- Description
Term entity has the following attributes:
- Term_id – primary key
- Term_name
User entity has the following attributes:
- User_id – primary key
- Username
- Password
- Complete_name
- Email_address
- Account_status
Note: all attributes with underline represents the primary key of the entity or table.
The next step is to convert the plan designed on ER Diagram into the actual database, please search for the Student Performance Tracking article which was already posted.
Summary
An Entity Relationship Diagram (ERD) is a visual representation of entities and their relationships to each other in a database management system. In a student performance tracking system, ERD can be used to model the relationships between students, subjects, grades, criteria, terms, and scores.
- The benefits of using an ERD in a student performance tracking system are as follows:
- Improved Data Management: ERD provides a clear understanding of the relationships between different entities, which can help improve the accuracy and efficiency of data management in a student tracking system.
- Better Data Integrity: ERD helps enforce the rules and constraints that govern the relationships between entities, which can help ensure the integrity of data in the system.
- Enhanced Data Visualization: ERD provides a visual representation of the relationships between entities, making it easier to understand the structure of data and identify relationships between different pieces of information.
- Improved Decision-Making: ERD makes it easier to identify trends and patterns in student performance data, which can help educators and parents make more informed decisions about how to support student success.
- Improved Collaboration: ERD can be shared with educators, parents, and students, which can help facilitate collaboration and communication between all parties involved in a student’s education.
In summary, using an ERD in a student performance tracking system can help improve data management, ensure data integrity, enhance data visualization, improve decision-making, and facilitate collaboration.
Readers are also interested in:
Student Tracking Performance Database Design
Student Performance Tracking Conceptual Framework
You may visit our Facebook page for more information, inquiries, and comments. Please subscribe also to our YouTube Channel to receive free capstone projects resources and computer programming tutorials.
Hire our team to do the project.