Bar Graph in VB.Net Tutorial and Source code
Problem
Create a Windows Form Application program in Visual Basic.Net that will allow users to create a bar graph.
Description
This tutorial is a step by step instruction on how to create a bar graph in VB.Net that connects to MS Access database.
Before the tutorial the following are required to start:
- Microsoft Visual Studio 2012 – Above
The tutorial starts here:
- Open Microsoft Visual Studio 2012
- Select a New Project on the File menu.
- Select Visual Basic, Windows Form Application then click OK.
- We need to design our form by the following controls:
- 1 Button – 1 button to Read the file and 1 button to update the content
- 1 chart – for the presentation of the chart
- We will also name our form controls in this way:
- txttext is the name of the textbox.
- Chart1 is the name of the chart.
- This is how we design the form. (Feel free to layout your own)
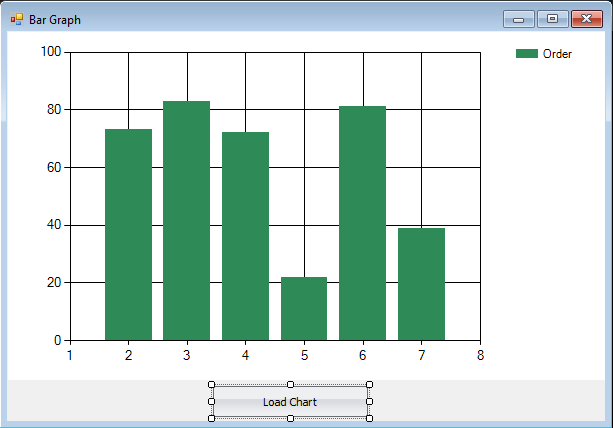
Figure 1. Design of the Form
- Create a module and paste the following codes.
Code here
Public conn As OleDbConnection
    Public cmd As OleDbCommand
    Public da As OleDbDataAdapter
    Public dt As DataTable
    Public dr As OleDbDataReader
    Public Result As Integer
    Public Sql As String
    Public Sub DatabaseConnect()
        Try
            conn = New OleDbConnection
            conn.ConnectionString = "Provider=Microsoft.Jet.OLEDB.4.0;Persist Security Info=false;Data Source=../debug/bargraph.mdb"
            conn.Open()
        Catch ex As Exception
            MsgBox(ex.Message)
        End Try
    End Sub
End Code
Code Explanation:
These will serve as the connection from the database to the bar graph.
- Double click the load chart button and paste the following code:
Code here
Try
            DatabaseConnect()
            Sql = "Select ShipCity, Total, Count, OrderId From orders"
            cmd = New OleDbCommand(Sql, conn)
            dr = cmd.ExecuteReader()
            dt = New DataTable
            dt.Load(dr)
            Chart1.Series.Add("Orders")
            Chart1.Series("Order").XValueMember = "ShipCity"
            Chart1.Series("Order").YValueMembers = "Total"
            Chart1.Series("Orders").XValueMember = "Count"
            Chart1.Series("Orders").YValueMembers = "OrderId"
            Chart1.DataSource = dt
            Chart1.DataBind()
        Catch ex As Exception
            MsgBox(ex.Message)
        Finally
            conn.Close()
End Try
End Code
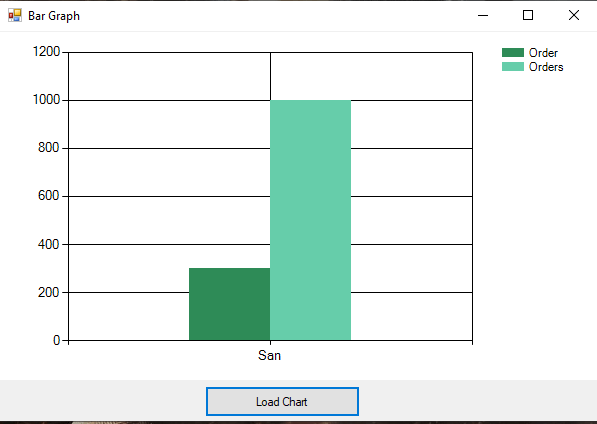
Code Explanation:
This code will connect to the ms access database, execute the sql query and load the data into the bar graph.
Author:
Name: Charlie Devera
Email Address: charliedevera000@gmail.com
Free Download Source code (Bar Graph in VB.Net)
You may visit our Facebook page for more information, inquiries, and comments. Please subscribe also to our YouTube Channel to receive free capstone projects resources and computer programming tutorials.
Hire our team to do the project.