Fusion Chart in Visual Basic 6 with database
A chart is a graphical representation used to display a certain piece of records or information; it makes the report more understandable.
Visual Basic is capable of inserting a chart component that allows the programmer to embed graphical reports in a form of chart or graph (bar, line, pie, etc.). In this tutorial, we are going to use a 3rd party extension for chart component and that utility is Fusion Chart for Visual Basic.
This tutorial is combination of Fusion Chart, Visual Basic 6 and MS Access Database.
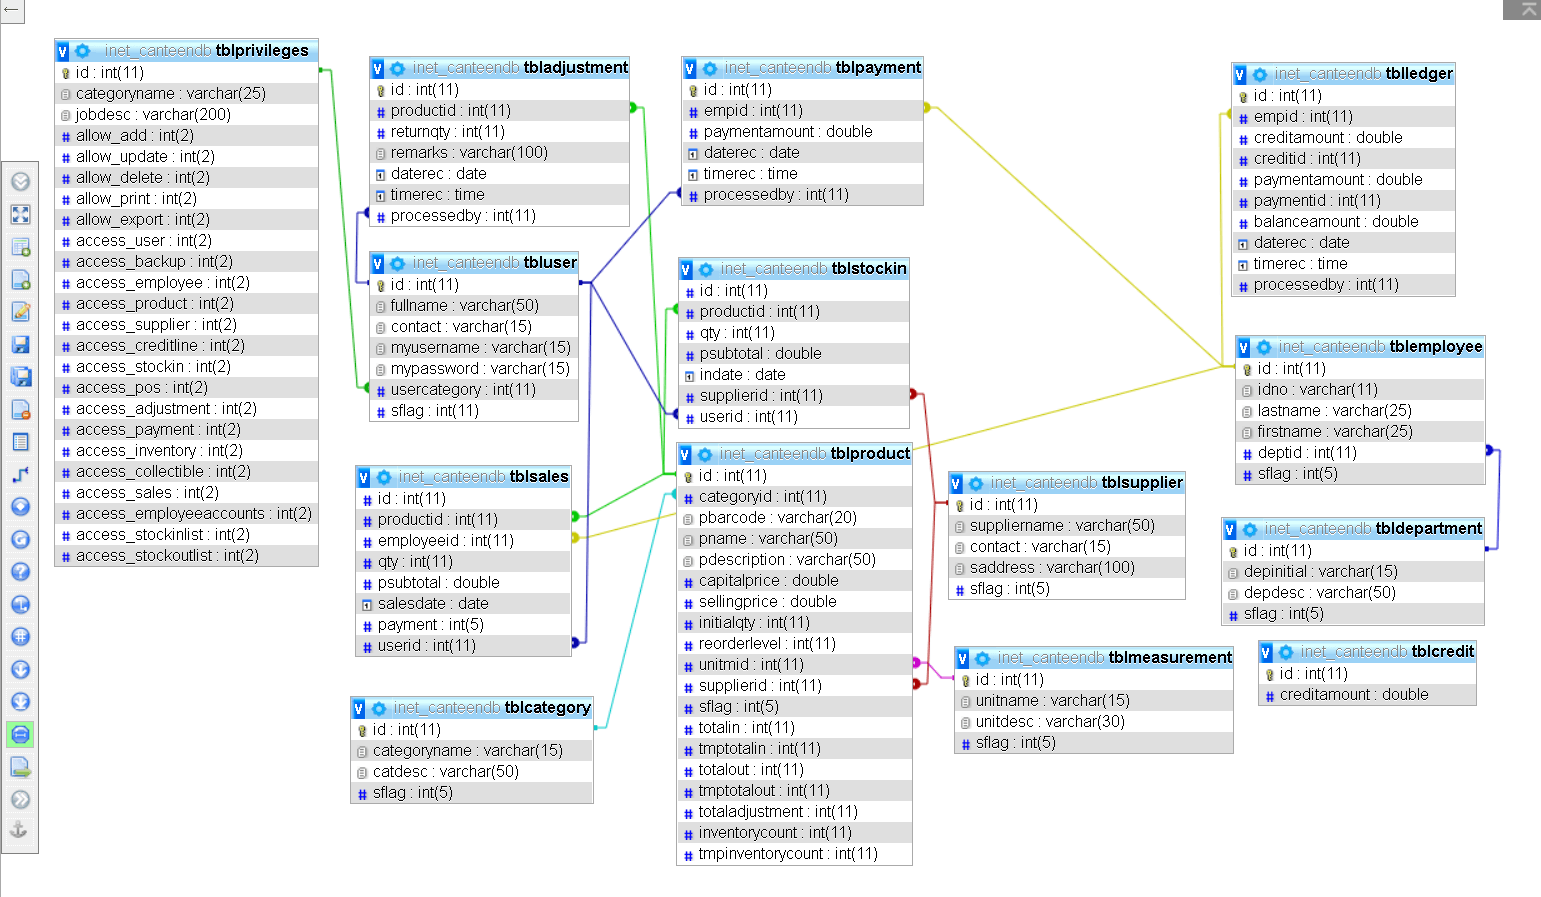
Database Design
1. We must first create a MS Access database and save it as Data.mdb.
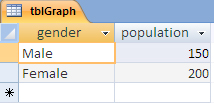
2. Create a new table and save it as tblGraph.
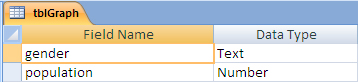
3. Save the table and insert the following field:
Field name – Data Type
gender – Text
population – Number
The table should look like the image below:
4.We will now put data on the database.Insert the following data:
5. Save the table and close the database.
Download and Install Fusion Chart
Kindly download fusion chart for visual basic installer and install it on your computer.
Visual Basic Project
We will skip the procedures on how to connect visual basic 6 to ms access, but if you have forgot that, kindly visit the tutorial on how to connect vb6 to ms access.
Note: The DBConnect module used in this project is different from the tutorial on how to connect vb6 to ms access. There are codes inserted in the module for us to used FusionCharts component in our visual basic project.
1. Open your visual basic 6 program and create a new project, select Standard EXE.
2. Let’s add a form to our project and save it as ChartFrm.
3. Since we have already installed fusion chart for vb, we can use it in our project. We must add it first in the components, go to Projects in the menu bar and select Components. Kindly look for FusionCharts for VB, check it and click OK.
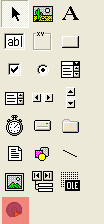
The highlighted one is the FusionCharts object.
4. Drag the FusionCharts object in the form.
5. Next is to create a code that will fetch the record from the database and convert that record into bar graph.
Double click the form and paste the code below.
Dim rsLocal As New ADODB.Recordset, msql As String
Dim chartParameters As String

chartParameters = "caption=Bar Graph Demo;xAxisName=Gender;yAxisName=Population"

If rsLocal.State = adStateOpen Then rsLocal.Close

msql = " Select * From tblGraph"

rsLocal.Open msql, conn

Call FusionCharts1.Data.setChartParams(chartParameters)

    Call FusionCharts1.Data.addDataFromDatabase(rsLocal, "population", "gender")
    FusionCharts1.RenderChart
6. Save the project and press F5 to test the project.
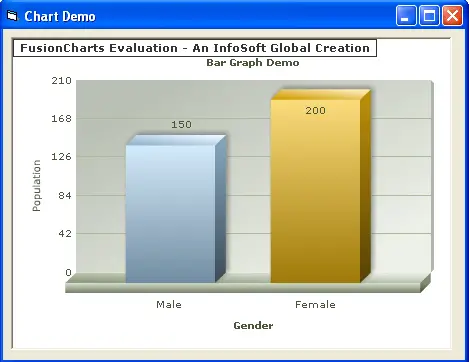
The output would be.

As you can see, the record from the database has turned into animated bar graph.
For suggestions, comments and for more information about the tutorial, you can email us or you can post your queries in the comment box.