Introduction
Table of Contents
In today’s data-driven world, managing and organizing data efficiently is crucial for systems across all domains. One such domain that demands meticulous data organization is the Vehicle Impoundment System, particularly when it intersects with dynamic environments like sports and cultural events. These events often involve high traffic, temporary regulations, and numerous vehicle violations, making impoundment data complex and expansive.
Vehicle impoundment involves the legal seizure of vehicles due to infractions such as illegal parking, lack of permits, or expired documents. When such impoundments occur during large-scale events, the volume of data—vehicles, owners, violation types, dates, impounding officers, and more—escalates rapidly. To manage this effectively, a robust data architecture is required. This is where Entity Relationship Diagrams (ER Diagrams) become essential.
An ER Diagram is a conceptual blueprint of how data entities relate to one another within a system. It defines entities (like Vehicle, Owner, Officer), their attributes (like License Plate, Name, Badge Number), and the relationships between them. In database design, ER Diagrams play a vital role by simplifying complex systems and ensuring a well-structured, normalized database.
This blog post serves as a comprehensive guide for understanding and creating an ER Diagram tailored to a Vehicle Impoundment System, with a specific focus on its application during sports and cultural events. You will learn about the domain, the challenges it presents, the fundamental components of ER Diagrams, and step-by-step instructions to design one. We’ll also include a PlantUML script to visually represent the system with clear, non-intersecting lines for readability.
Our target audience includes database designers, software developers, computer science students, and event logistics planners who want to streamline impoundment data management. Whether you’re designing a municipal impoundment database or developing software for event traffic regulation, this guide will provide the foundational knowledge and practical tools to get started.
Overview of the Domain
The Vehicle Impoundment System is a legal and administrative framework used to seize vehicles that violate regulations. In the context of sports and cultural events, the system becomes even more critical due to increased vehicle flow, temporary traffic patterns, and heightened security. Typical reasons for impoundment during such events include unauthorized parking, entry without permits, or security violations.
Key components of the system include:
- Vehicles: Identified by registration numbers, types, and ownership.
- Owners: Individuals or organizations responsible for the vehicle.
- Impounding Officers: Personnel authorized to enforce regulations.
- Impound Yards: Locations where vehicles are stored.
- Events: Contextual elements adding layers of regulation.
- Violations: Documented offenses triggering impoundment.
Each vehicle impoundment event must be logged with precise details—officer ID, event name, violation type, and vehicle info. These records are essential for auditing, owner notification, and potential vehicle release.
The main challenge in data management is ensuring accuracy, consistency, and quick access to impoundment records. During events, impoundments can happen in large volumes, making manual recordkeeping prone to errors. ER Diagrams address these challenges by mapping out how each data point is interconnected, reducing redundancy and optimizing retrieval.
Use Case Example: During a major city marathon, hundreds of cars are parked illegally along the route. Officers impound these vehicles, and the data system must log each incident with real-time accuracy. The ER Diagram ensures the database schema can handle these operations smoothly, from logging to retrieval and release.
Key Concepts of ER Diagrams
At its core, an Entity Relationship Diagram (ER Diagram) is a visual tool used in database design. It represents the logical structure of a database through:
- Entities: Real-world objects (e.g., Vehicle, Owner, Event).
- Attributes: Details of each entity (e.g., Vehicle’s license number, Event’s name).
- Relationships: How entities interact (e.g., Vehicle belongs to Owner).
- Primary Keys (PK): Unique identifiers for entities.
- Foreign Keys (FK): References linking entities.
Let’s apply these to the Vehicle Impoundment System:
- A Vehicle entity may have attributes like Vehicle_ID (PK), License_Number, Type.
- An Owner entity includes Owner_ID (PK), Name, Contact_Info.
- A Violation entity might include Violation_ID (PK), Violation_Type, and Date.
- The relationship Owner OWNS Vehicle is one-to-many.
- Vehicle IS_IMPOUNDED_FOR Violation is many-to-one.
- Event HAS Impounded Vehicles creates a link between specific cultural/sports events and impoundments.
Visual Example (Textual Only):
[Owner]
+ Owner_ID <<PK>>
+ Name
+ Contact_Info

[Vehicle]
+ Vehicle_ID <<PK>>
+ License_Number
+ Type
+ Owner_ID <<FK>>

Relationship: Owner ||--o{ Vehicle ("owns")
This simplified structure shows how core entities connect, setting the stage for a scalable, efficient database.
Designing the ER Diagram for Vehicle Impoundment System
Step 1: Identify Entities
- Vehicle
- Owner
- Impounding Officer
- Event
- Violation
- Impound Yard
- Ticket
- Payment
- Release Request
- Vehicle Type
Step 2: Define Attributes
- Vehicle: Vehicle_ID (PK), License_Number, Vehicle_Type_ID (FK), Owner_ID (FK)
- Owner: Owner_ID (PK), Name, Contact
- Impounding Officer: Officer_ID (PK), Name, Badge_Number
- Event: Event_ID (PK), Event_Name, Location, Date
- Violation: Violation_ID (PK), Type, Description
- Impound Yard: Yard_ID (PK), Address, Capacity
- Ticket: Ticket_ID (PK), Vehicle_ID (FK), Officer_ID (FK), Violation_ID (FK), Event_ID (FK), Issue_Date
- Payment: Payment_ID (PK), Ticket_ID (FK), Amount, Date
- Release Request: Request_ID (PK), Ticket_ID (FK), Status, Date
- Vehicle Type: Vehicle_Type_ID (PK), Description
Step 3: Establish Relationships
- Vehicle BELONGS_TO Owner
- Vehicle HAS Vehicle Type
- Officer ISSUES Ticket
- Ticket IS_FOR Violation
- Ticket IS_ASSOCIATED_WITH Event
- Ticket IS_LINKED_TO Vehicle
- Ticket RESULTS_IN Payment
- Vehicle IS_STORED_IN Impound Yard
- Ticket TRIGGERS Release Request
Step 4: Specify Constraints
- Primary keys ensure uniqueness.
- Foreign keys maintain referential integrity.
- Cardinality: One Owner can have many Vehicles, one Ticket is linked to one Vehicle, etc.
Textual Description:
The ER Diagram represents a system where each impounded vehicle is associated with a ticket, issued by an officer during an event. Vehicles are linked to their owners and vehicle types. Violations tied to the ticket inform payments and release requests. Vehicles are stored in impound yards, and all relationships maintain clean, non-overlapping structure for optimal clarity.
ER Diagram Example
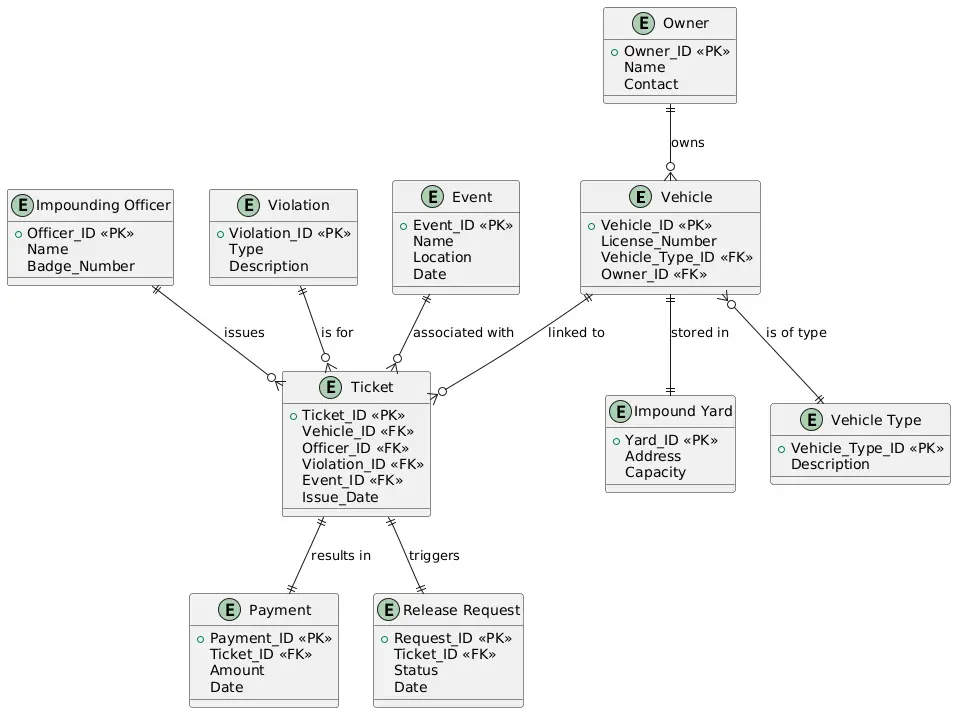
Imagine a large cultural festival in a city, where vehicles without permits are regularly impounded. The system must track each impoundment, issue tickets, and process payments and release requests. Below is a clear, logical breakdown:
- Entities:
- Vehicle (License Number, Type)
- Owner (Name, Contact)
- Officer (Badge Number)
- Ticket (links Vehicle, Officer, Violation, and Event)
- Violation (Type, Severity)
- Event (Event Name, Date)
- Impound Yard (Location)
- Payment, Release Request, Vehicle Type
Each entity is connected. For example:
- Vehicle 123XYZ is linked to John Doe (Owner), was impounded by Officer Jane (Badge #556), during the “Spring Carnival,” for “Unauthorized Parking,” stored at “Yard A”, with Ticket #T987, later paid and requested for release.
This real-world simulation demonstrates the importance of connecting all related data logically.
PlantUML Script
@startuml

entity "Vehicle" as Vehicle {
+Vehicle_ID <<PK>>
License_Number
Vehicle_Type_ID <<FK>>
Owner_ID <<FK>>
}

entity "Owner" as Owner {
+Owner_ID <<PK>>
Name
Contact
}

entity "Impounding Officer" as Officer {
+Officer_ID <<PK>>
Name
Badge_Number
}

entity "Violation" as Violation {
+Violation_ID <<PK>>
Type
Description
}

entity "Event" as Event {
+Event_ID <<PK>>
Name
Location
Date
}

entity "Impound Yard" as Yard {
+Yard_ID <<PK>>
Address
Capacity
}

entity "Ticket" as Ticket {
+Ticket_ID <<PK>>
Vehicle_ID <<FK>>
Officer_ID <<FK>>
Violation_ID <<FK>>
Event_ID <<FK>>
Issue_Date
}

entity "Payment" as Payment {
+Payment_ID <<PK>>
Ticket_ID <<FK>>
Amount
Date
}

entity "Release Request" as Request {
+Request_ID <<PK>>
Ticket_ID <<FK>>
Status
Date
}

entity "Vehicle Type" as VType {
+Vehicle_Type_ID <<PK>>
Description
}

Owner ||--o{ Vehicle : "owns"
Vehicle }o--|| VType : "is of type"
Vehicle ||--o{ Ticket : "linked to"
Officer ||--o{ Ticket : "issues"
Violation ||--o{ Ticket : "is for"
Event ||--o{ Ticket : "associated with"
Ticket ||--|| Payment : "results in"
Ticket ||--|| Request : "triggers"
Yard ||--o{ Vehicle : "stores"

@enduml
Best Practices
- Normalize your data to reduce redundancy. For example, having a separate Vehicle Type table prevents repetitive entries.
- Use clear naming conventions for entities and attributes.
- Limit many-to-many relationships with junction tables.
- Document constraints like primary and foreign keys explicitly.
- Test the model with real scenarios for validation.
Common pitfalls:
- Overcomplicating the ERD by merging unrelated domains.
- Ignoring event-specific attributes.
- Failing to include key entities like Ticket or Event.
Recommended tools:
- Draw.io
- Lucidchart
- MySQL Workbench
- ERDPlus
Real-World Applications
A well-designed ER Diagram is crucial for real-world applications such as:
- Municipal Impoundment Software
- Event Management Tools
- Smart City Platforms
Cities hosting events like marathons or festivals use these systems to automate impound tracking. For example, New York City’s DOT uses centralized systems that track vehicles via tickets and violations in real time.
Conclusion
The Vehicle Impoundment System ER Diagram is an essential tool in organizing and managing complex event-based enforcement data. By modeling entities like Vehicles, Owners, Officers, Tickets, and Events, it helps developers and planners design efficient, scalable databases. Whether for student projects or municipal implementations, this guide equips you with a structured approach to tackling such a system.
Start creating your own ER Diagram and see how it transforms chaotic data into clear insights. Share your diagrams or questions in the comments below and stay tuned for our next post on implementing this ERD in SQL!
You may visit our Facebook page for more information, inquiries, and comments. Please subscribe also to our YouTube Channel to receive free capstone projects resources and computer programming tutorials.
Hire our team to do the project.