Transcript of Records Processing System ER Diagram
The project entitled Transcript of Records Processing System is an information system that manages the grades of the students in preparation for the processing of their transcript of records that will be used by the students for the purpose of job application; transfer to others schools and many more.
This article will discuss the step by step process on how to prepare the entity relationship diagram or ERD of the project entitled Transcript of Records Processing System.
The ER Diagram serves as the graphical representation of the database design of an information system, during the requirements analysis, the researchers needs to present and explain the database design in a way that the non-technical people can understand.
The first step in the development of the Transcript of Records Processing System is to prepare the ER diagram that will serve as the basis later on in the creation of the actual database.
We will create and explain the process of making the entity relationship diagram of Transcript of Records Processing System.
Let’s start from the symbols used in the ER Diagram.
Entity is represented by the rectangle shape. The entity will be our database table of Transcript of Records Processing System later on.
Attribute is represented by the oval shape. This will be the columns or fields of each table in the Transcript of Records Processing System.
Relationship is represented by diamond shape. This will determine the relationships among entities. This is usually in a form of primary key to foreign key connection.
We will follow the 3 basic rules in creating the ER Diagram.
- Identify all the entities.
- Identify the relationship between entities and
- Add meaningful attributes to our entities.
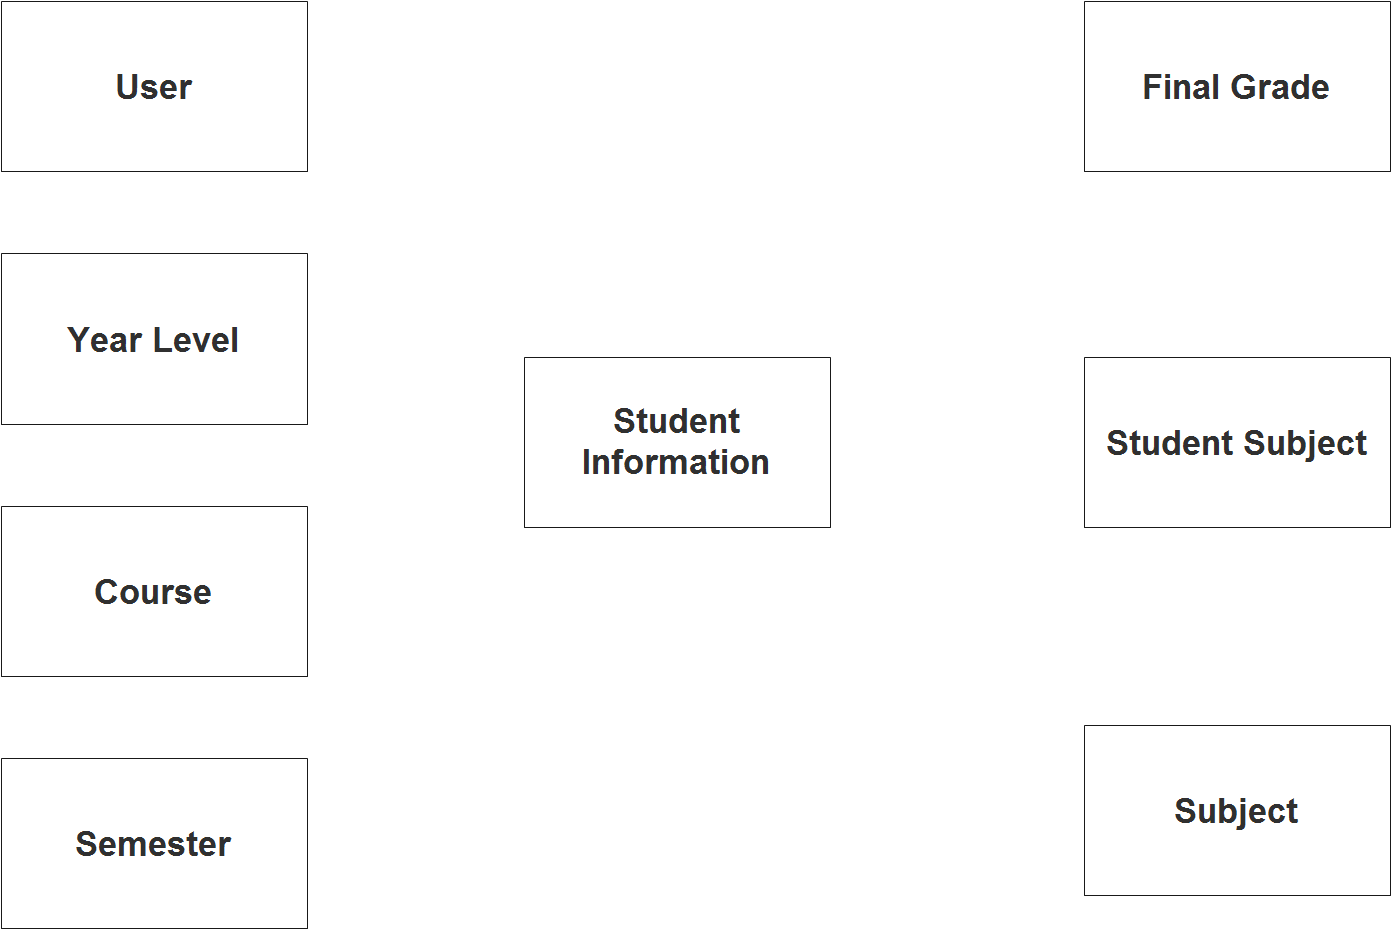
Step 1. In the Transcript of Records Processing System we have the following entities
- User
- Year Level
- Course
- Semester
- Student
- Final Grade
- Student Subject
- Subject
We will now draw the entities of the Transcript of Records Processing System specified above and it will be represented by a rectangle shape. The image below is the entities identified in the scope of the Transcript of Records Processing System.
Step 2. After we have specified our entities, it is time now to connect or establish a relationship among the entities.
The image below represents the entities and their relationship among each other.
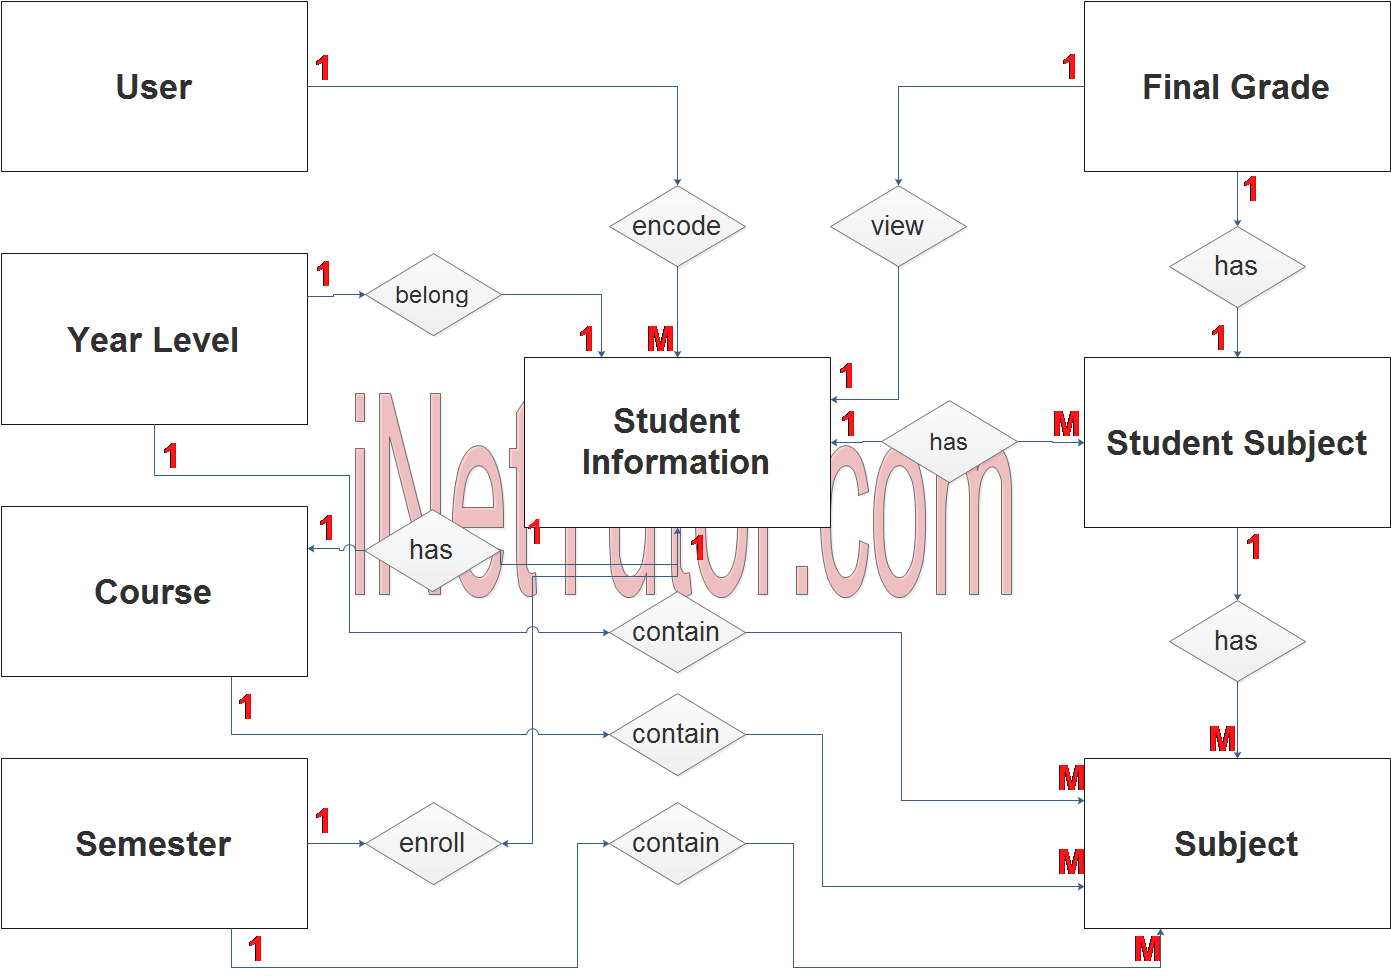
Explanation:
- The user encodes, approves or updates the student information (1 to many relationship).
- The student belongs to a specific year level (1 to 1 relationship).
- The student belongs to a specific course (1 to 1 relationship).
- The student is enrolled in a semester (1 to 1 relationship).
- The student has multiple subjects (1 to many relationship).
- Student subjects are linked in the subjects record (1 to many relationship).
- A student has a final grade per subject (1 to 1 relationship).
- Every year level contains subject offering (1 to many relationship).
- Every course has sets of subject offering (1 to many relationship).
- Every semester contains subject offering (1 to many relationship).
Step 3. The last part of the ERD process is to add attributes to our entities.
The image below represents the complete ER diagram of the transcript of records processing system with the entities and their attributes.
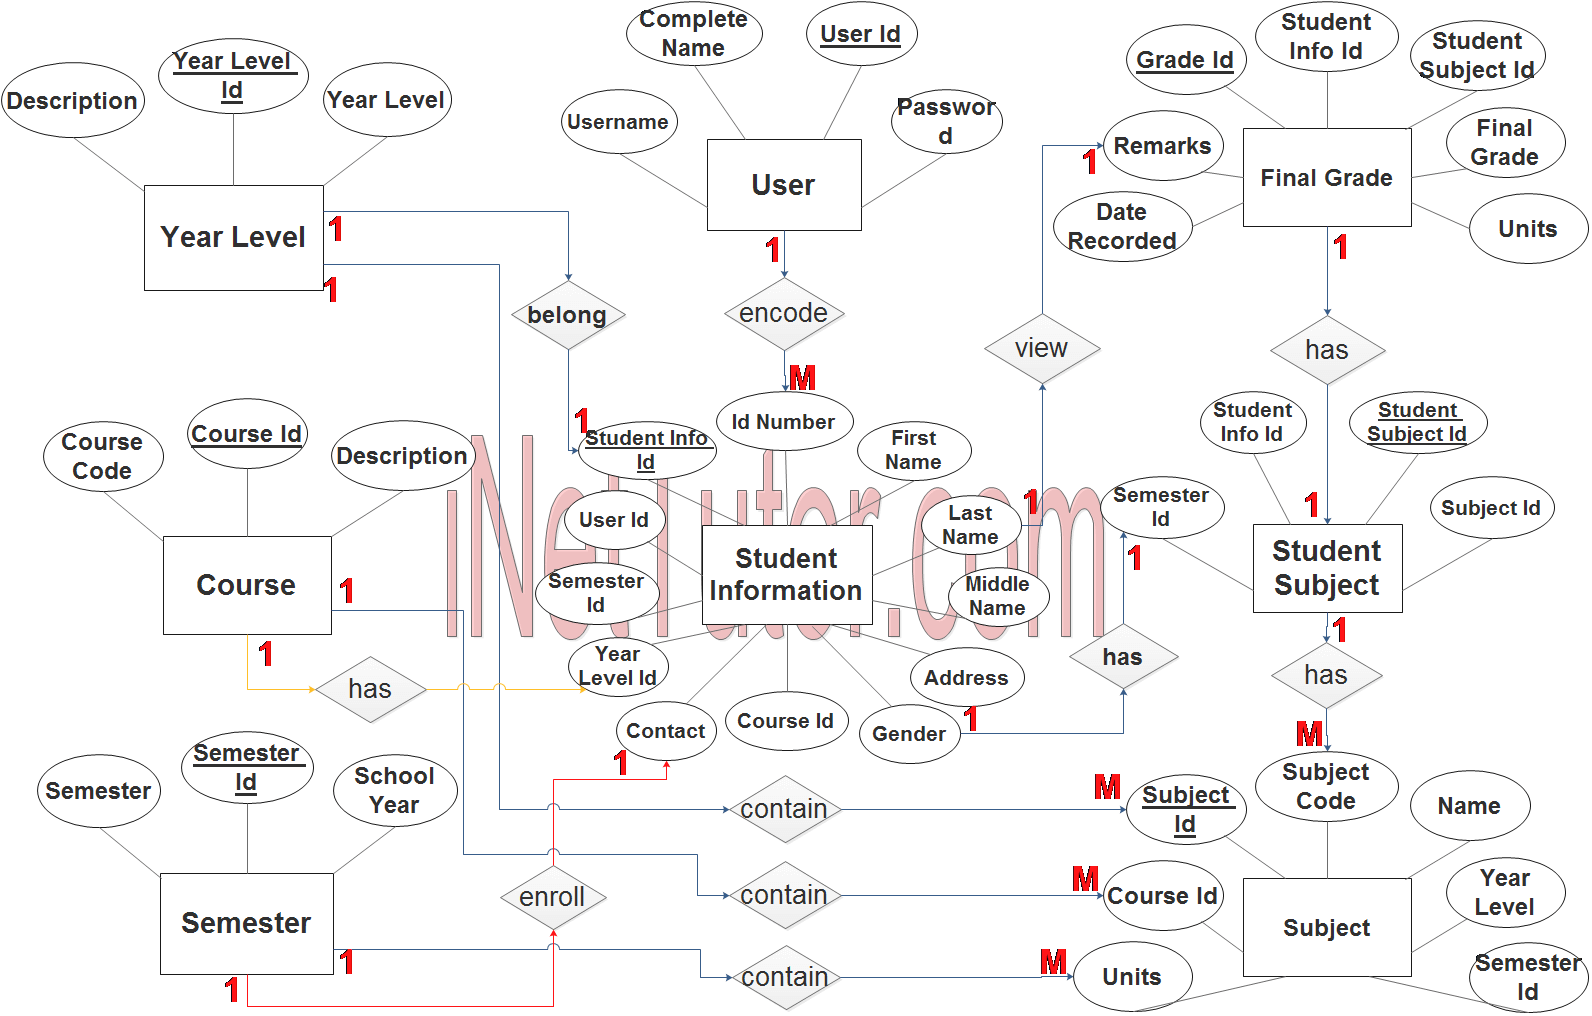
User Entity has the following attributes:
- User ID – primary key represented with underline
- Complete name
- Username
- Password
Year Level Entity has the following attributes:
- Year Level ID – primary key represented with underline
- Year Level
- Description
Course Entity has the following attributes:
- Course ID – primary key represented with underline
- Course Code
- Description
Semester Entity has the following attributes:
- Semester ID – primary key represented with underline
- Semester
- School Year
Student Entity has the following attributes:
- Student Info ID – primary key represented with underline
- ID Number
- First name
- Last name
- Middle name
- Address
- Gender
- Contact
- Course ID – foreign key
- Year Level ID – foreign key
- Semester ID – foreign key
- User ID – foreign key
Final Grade Entity has the following attributes:
- Grade ID – primary key represented with underline
- Student Info ID – foreign key
- Student subject ID – foreign key
- Final Grade
- Units
- Remarks
- Date Recorded
Student Subject Entity has the following attributes:
- Student Subject ID – primary key represented with underline
- Student Info ID – foreign key
- Subject ID – foreign key
- Semester ID – foreign key
Subject Entity has the following attributes:
- Subject ID – primary key represented with underline
- Subject Code
- Name
- Units
- Year Level – foreign key
- Semester ID – foreign key
- Course ID – foreign key
Note: all attributes with underline represents the primary key of the entity or table.
The next step is to convert the plan designed on ER Diagram into the actual database, please search for the Transcript of Records Processing System article which was already posted.
Contact us on our facebook page for the softcopy of the Transcript of Records Processing System.
You may visit our facebook page for more information, inquiries and comments.
Hire our team to do the project.