Attendance System ER Diagram
Attendance System is an information system that monitors the presence of someone in an event, activity, work and classroom. Specifically, this attendance system was designed to monitor the attendance of students in the activities conducted in the school such as the intramurals, buwan ng wika and other important events that requires the presence of the students.
This article will discuss the step by step process on how to prepare the entity relationship diagram or ERD of the project entitled Attendance System.
The first step in the development of the Attendance System is to prepare the ER diagram that will serve as the basis later on in the creation of the actual database.
We will create and explain the process of making the entity relationship diagram of attendance system.
Let’s start from the symbols used in the ER Diagram.
Entity is represented by the rectangle shape. The entity will be our database table of Attendance System later on.
Attribute is represented by the oval shape. This will be the columns or fields of each table in the Attendance System.
Relationship is represented by diamond shape. This will determine the relationships among entities. This is usually in a form of primary key to foreign key connection.
We will follow the 3 basic rules in creating the ER Diagram.
- Identify all the entities.
- Identify the relationship between entities and
- Add meaningful attributes to our entities.
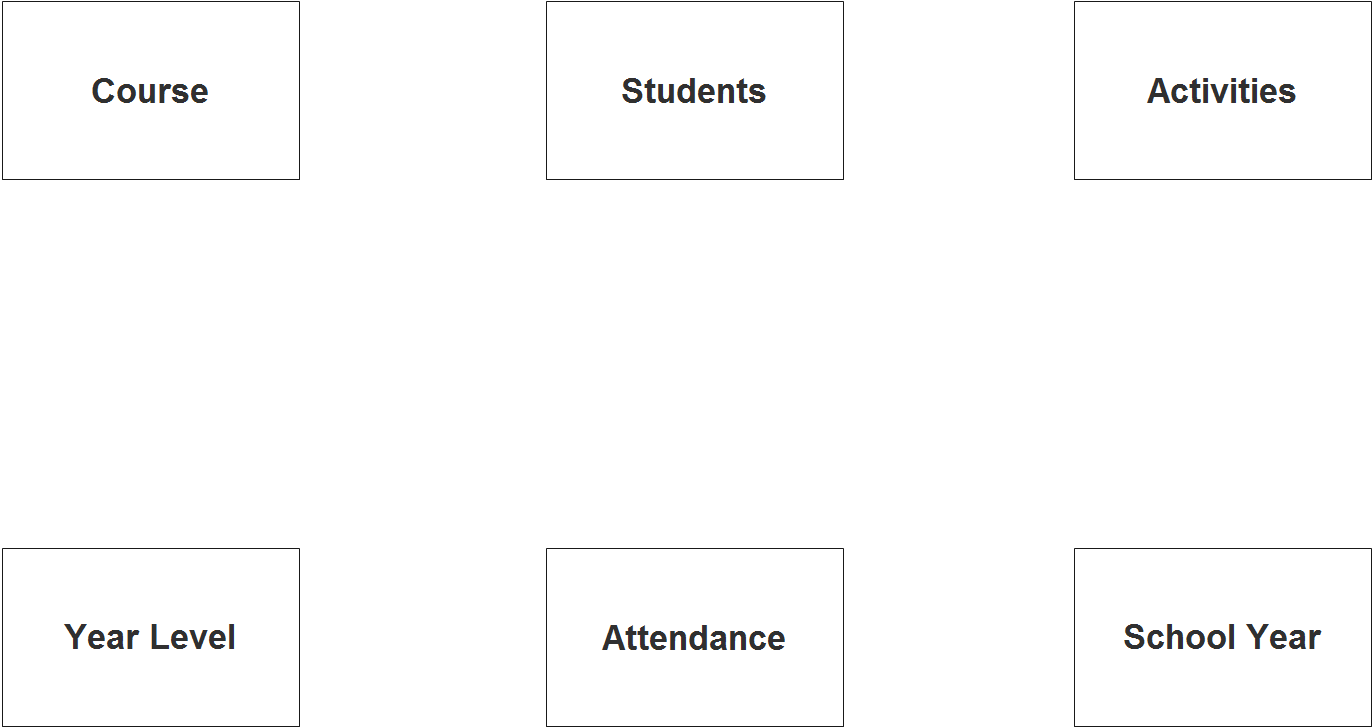
Step 1. In the Attendance System we have the following entities
- Course
- Students
- Activities
- Year Level
- Attendance
- School Year or Academic Year
We will now draw the entities of the Attendance System specified above and it will be represented by a rectangle shape.
Step 2. After we have specified our entities, it is time now to connect or establish a relationship among the entities.
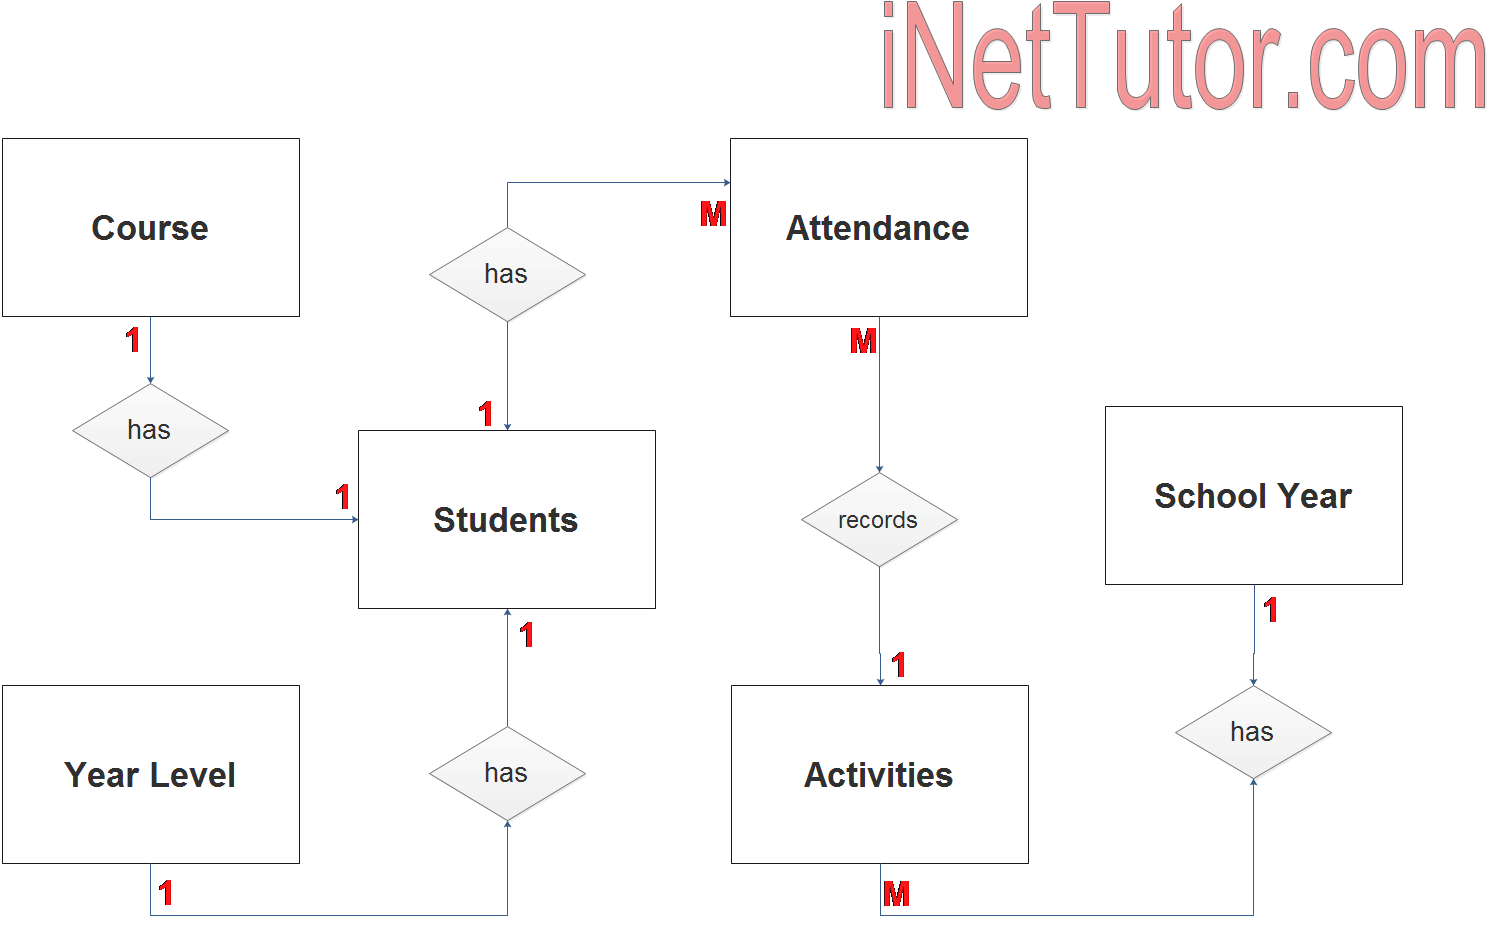
- student is enrolled in a course (1 to 1 relationship)
- student belongs to a year level (1 to 1 relationship)
- student attends to 1 or more event/activity (1 to many relationship)
- every activity collects attendance from the students (1 to many relationship)
- school year has 1 or more student activities conducted (1 to many relationship)
Step 3. The last part of the ERD process is to add attributes to our entities.
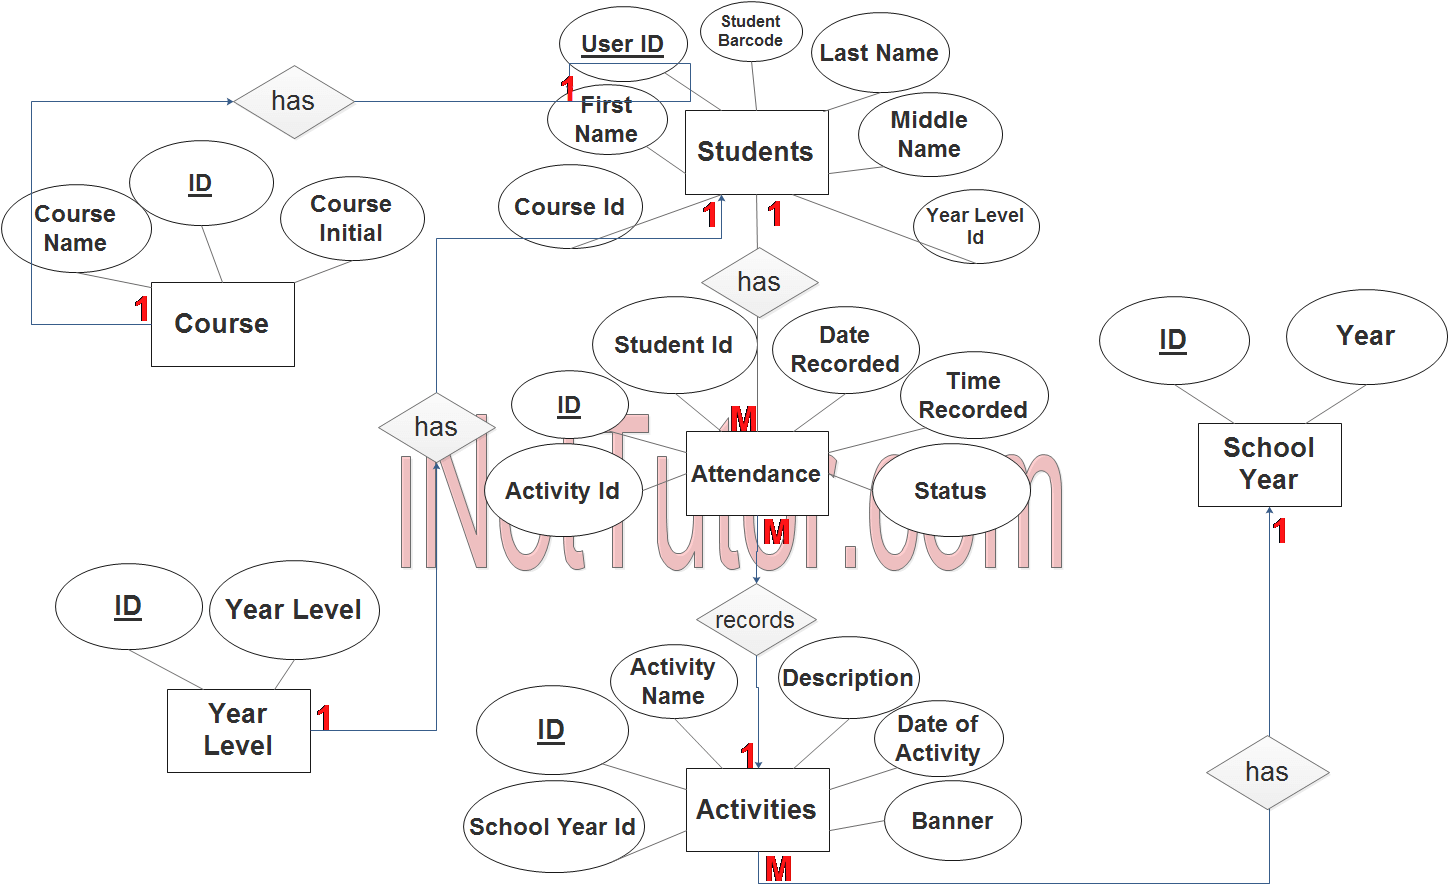
Course Entity has the following attributes:
- ID – primary key represented with underline
- Course name
- Course intial
Students Entity has the following attributes:
- User id – primary key represented with underline
- Student barcode
- First name
- Middle name
- Last name
- Course id – foreign key
- Year Level id – foreign key
Activities Entity has the following attributes:
- ID – primary key represented with underline
- Activity Name
- Description
- Date of Activity
- Banner
- School Year id – foreign key
Attendance Entity has the following attributes:
- ID – primary key represented with underline
- Student ID – foreign key
- Activity ID – foreign key
- Date recorded
- Time recorded
- Status
School Year Entity has the following attributes:
- ID – primary key represented with underline
- Year
Note: all attributes with underline represents the primary key of the entity or table.
The next step is to convert the plan designed on ER Diagram into the actual database, please search for the Attendance System article which was already posted.
Contact us on our facebook page for the softcopy of the Attendance System.
You may visit our facebook page for more information, inquiries and comments.
Hire our team to do the project.