AI-Powered Personalized Nutrition Planner Use Case Diagram
Introduction
Table of Contents
Imagine you’re developing an app that tailors meal plans to a user’s health goals. You’re excited, but then questions start pouring in—what features should the app have? Who will use it? What exactly will each user do?
This is where use case diagrams come in.
Use case diagrams are a part of system design that help map out how users interact with a system. These diagrams use simple visuals to show what the system does and who uses it. They’re like a blueprint for your IT project. Think of them as the first sketch of your software’s functionality—a way to get everyone on the same page before diving into code.
For IT students and developers, learning to create clear use case diagrams is essential. These diagrams make it easier to understand a project’s scope and requirements. They help identify users (called “actors”) and show what actions they can perform. Whether you’re building an AI-powered nutrition planner, a payroll system, or any other software, use case diagrams make planning smoother.
This blog post is here to guide you. I’ll show you how to create a use case diagram for an AI-Powered Personalized Nutrition Planner—a system that recommends personalized meal plans based on user data like age, preferences, and health goals. Along the way, I’ll use beginner-friendly explanations and practical examples. You’ll also learn how these diagrams apply to other systems, like payroll or inventory management.
Here’s what to expect:
- First, I’ll explain the basics of use case diagrams and their components.
- Then, we’ll look at the AI Nutrition Planner system as a real-world example.
- I’ll share a ready-to-use PlantUML script so you can visualize it easily.
- Finally, we’ll wrap up with best practices and tips for creating clean, useful diagrams.
If you’re looking to improve your system design skills and visualize your IT projects better, this guide is for you.
Let’s get started.

Understanding Use Case Diagrams
Use case diagrams help you map out how users interact with a system. They don’t show technical details. Instead, they focus on what users want to achieve. This makes them perfect for early-stage planning and communication.
Key Components of a Use Case Diagram:
- Actors: These are users or other systems that interact with your application. They’re shown as stick figures.
- Example: A “User” logs in to an app.
- Use Cases: These are the specific actions actors can perform. They’re shown as ovals.
- Example: “(View Meal Plan)” or “(Log Daily Intake)”
- System Boundary: A box that wraps around all the use cases, showing the scope of your system.
UML Basics:
- Stick figures = actors
- Ovals = use cases
- Lines = interactions between them
- Everything inside the box = part of your system
Why Use These Diagrams?
- They simplify communication between developers, clients, and stakeholders.
- They clarify what features your system should include.
- They help spot missing requirements early.
When to Use:
- During initial planning stages
- When gathering requirements
- Before database or UI design
Example Scenario:
Let’s say you’re designing a personalized nutrition planner:
- Actors: User, Nutritionist, System Admin
- Use Cases: Register, Set Health Goals, Generate Meal Plan, View Reports
In the diagram:
- The User interacts with use cases like “(Set Health Goals)” and “(Track Meals)”
- The Nutritionist can “(Review User Plans)”
- The Admin manages user data and system logs
This simple sketch gives everyone a shared understanding of the system.
By mastering the basics—actors, use cases, boundaries—you’ll be able to visualize any IT system quickly and clearly.
Use Case Diagram: AI-Powered Personalized Nutrition Planner Example
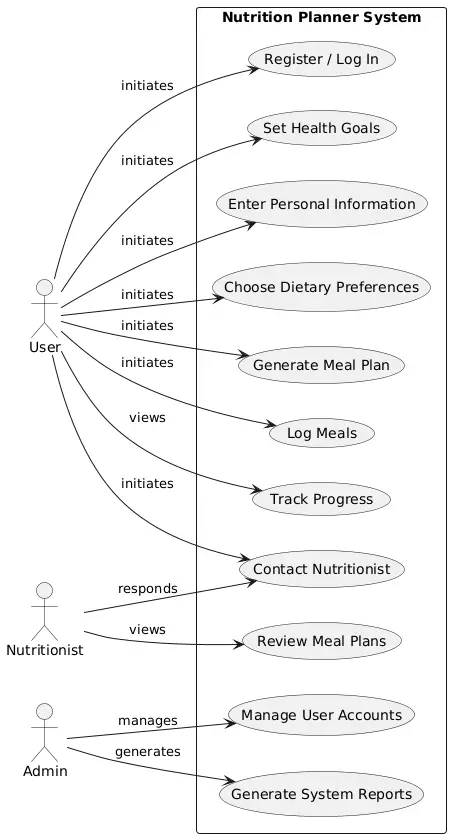
The AI-Powered Personalized Nutrition Planner is designed to help users receive custom meal plans based on their personal data and goals. It uses AI to analyze inputs like age, weight, allergies, and preferences.
System Purpose:
- Provide users with daily meal plans
- Track progress toward health goals
- Allow professionals to manage user data and refine recommendations
Key Actors:
- User: Sets health goals, enters personal data, and views recommendations.
- Nutritionist: Reviews and adjusts meal plans for clients.
- System Admin: Manages platform settings, user accounts, and reports.
Main Use Cases:
- Register / Log In
- Set Personal Information
- Choose Dietary Preferences
- Generate Meal Plan
- Log Daily Meals
- Track Progress
- Contact Nutritionist
- Admin Panel Access
Textual Description:
In the diagram, the User interacts with use cases like:
- (Set Health Goals)
- (Generate Meal Plan)
- (Log Meals)
- (Track Progress)
The Nutritionist connects to:
- (Review Meal Plans)
- (Communicate with User)
The Admin oversees:
- (Manage User Accounts)
- (Generate System Reports)
All these use cases fall within the system boundary labeled “Nutrition Planner System.”
Real-World Application:
This diagram helps both technical and non-technical team members understand what the system will do. Developers know which features to build. Nutritionists know what to expect from the interface. Project managers can track progress using these defined use cases.
Use case diagrams like this one make IT project visualization simple and effective.
PlantUML Script for AI-Powered Personalized Nutrition Planner Use Case Diagram
@startuml
left to right direction

actor User
actor Nutritionist
actor Admin

rectangle "Nutrition Planner System" {
(Register / Log In)
(Set Health Goals)
(Enter Personal Information)
(Choose Dietary Preferences)
(Generate Meal Plan)
(Log Meals)
(Track Progress)
(Contact Nutritionist)
(Review Meal Plans)
(Manage User Accounts)
(Generate System Reports)
}

User --> (Register / Log In) : initiates
User --> (Set Health Goals) : initiates
User --> (Enter Personal Information) : initiates
User --> (Choose Dietary Preferences) : initiates
User --> (Generate Meal Plan) : initiates
User --> (Log Meals) : initiates
User --> (Track Progress) : views
User --> (Contact Nutritionist) : initiates

Nutritionist --> (Review Meal Plans) : views
Nutritionist --> (Contact Nutritionist) : responds

Admin --> (Manage User Accounts) : manages
Admin --> (Generate System Reports) : generates

@enduml
Script Explanation
This PlantUML script lays out a clean, vertical use case diagram for the AI-powered personalized nutrition planner. On the left, we define the main actors: User, Nutritionist, and Admin. Each actor is linked to relevant use cases within the system boundary.
The rectangle labeled “Nutrition Planner System” contains all system functionalities. Each function—like “Generate Meal Plan” or “Track Progress”—is shown as a use case (oval). The relationships (e.g., initiates, views, manages) clarify how each actor interacts with the system.
For example:
- The User initiates most interactions such as entering personal info and generating plans.
- The Nutritionist reviews meal plans and responds to user messages.
- The Admin manages back-end tasks like user accounts and reports.
This setup avoids crossing lines and presents a logical, readable structure. It’s perfect for IT students and developers using tools like PlantUML to create professional diagrams for IT project visualization.
- Best Practices for Creating Use Case Diagrams (500 words)
Creating effective use case diagrams is both an art and a science. Here’s how to keep them clear and useful.
Practical Tips:
- Use clear, goal-based names: “Generate Meal Plan” is better than just “Meal Plan.”
- Focus on user actions: Capture what the actor wants to achieve, not internal system tasks.
- Keep diagrams clean: Use vertical or left-to-right alignment to avoid messy lines.
- Limit the scope: Include only major use cases in one diagram. Use sub-diagrams if needed.
- Validate with stakeholders: Show your diagram early to users or clients for feedback.
Common Mistakes to Avoid:
- Overcrowding the diagram with too many use cases
- Using vague or overly technical names
- Omitting key actors or use cases
- Forgetting to label relationships
- Making the system boundary too wide or unclear
Recommended Tools:
- Lucidchart – Drag-and-drop interface with collaboration features
- Draw.io – Free, easy to use, and Google Drive-friendly
- PlantUML – Great for developers who like code-based diagrams
These tools help you visualize systems quickly and adjust as your project evolves.
By following these best practices, your use case diagrams will not only look professional but also clearly communicate your system’s scope—especially for IT project planning tasks like the AI Nutrition Planner or payroll.
Conclusion
Use case diagrams are simple, powerful tools for IT project success. Whether you’re building a payroll system or a personalized nutrition planner, these diagrams help you map out who does what and how.
They give developers, clients, and students a shared visual language for planning system features. Instead of diving into code blindly, you get a high-level view that ensures nothing important is missed.
In this blog, we looked at how use case diagrams work, how to create one for an AI-powered nutrition planner, and what tools and best practices can help you get started.
If you’re a student or developer working on an IT project, I highly recommend using use case diagrams early in your planning. They’ll save you time, reduce confusion, and help you communicate your ideas clearly.
Got a system you want diagrammed next? Maybe an e-commerce site or a school management app? Drop your ideas or questions in the comments!
Try out tools like Draw.io or PlantUML, create your own diagrams, and share them with your team—or even here with us.
Let’s keep building smarter, more efficient systems together—with use case diagrams guiding the way.
You may visit our Facebook page for more information, inquiries, and comments. Please subscribe also to our YouTube Channel to receive free capstone projects resources and computer programming tutorials.
Hire our team to do the project.