Farm2Market ERD: Farmer-to-Retailer Web Application Diagram
Introduction
Table of Contents
In today’s digitally connected world, platforms that link farmers directly to retailers play a critical role in reducing intermediaries, improving income for producers, and ensuring quality produce for consumers. A Farmer-to-Retailer Web Application like Farm2Market is a data-rich environment that manages inventory, transactions, deliveries, events, and user interactions. Efficient data management is vital to support the platform’s performance, scalability, and accuracy.
This is where Entity Relationship Diagrams (ERDs) come in. ERDs visually represent the structure of a database by outlining entities (like Farmers, Products, Orders), their attributes (such as Farmer Name, Product Price), and relationships (e.g., a Farmer supplies Products). By mapping out these elements, developers and database designers can create a solid database schema that aligns with the system’s functional needs.
This blog post will guide you in understanding and creating an ER Diagram specifically for a Farmer-to-Retailer Web Application like Farm2Market. Whether you’re a student working on an IT capstone project, a developer building a prototype, or a database designer planning a robust backend, this post will help you break down complex domain data into clear, structured diagrams.
We’ll walk through domain components, ERD basics, step-by-step diagram construction, and provide a real-world example complete with a PlantUML script. You’ll also discover best practices and real-world use cases that showcase the ERD’s value in managing farm-to-market ecosystems, including handling sports and cultural events that support community engagement and revenue.
Overview of the Domain
The Farm2Market domain connects local farmers with retailers through an intuitive web platform that facilitates product listings, orders, deliveries, and event promotions. The core components include:
- Farmers: Users who supply fresh produce or other farm goods.
- Retailers: Buyers who browse and order listed products.
- Products: Items listed by farmers for sale.
- Orders: Transactions initiated by retailers.
- Deliveries: Logistics for order fulfillment.
- Events: Sports or cultural events where farmers promote goods.
- Payments: Transactions and earnings tracking.
The platform must manage user registrations, product updates, real-time stock levels, event scheduling, and payment processing. It also supports event registrations for both sports (like community farming tournaments) and cultural activities (like harvest festivals), enhancing the platform’s community-centric value.
Data management becomes complex when multiple stakeholders interact frequently. ERDs help untangle this complexity by clearly defining how each piece of information relates. Without a well-structured data model, you risk redundancies, data inconsistencies, and scalability issues.
Consider this example: A local cooperative organizes a weekend farmer’s market where members can sell their produce and promote cultural crafts. Retailers attending can pre-order products through the app and choose to attend associated events. Without a structured data system, tracking attendees, orders, and event logistics would be chaotic.
ERDs solve this by visually modeling every piece of data and their relationships, creating a strong foundation for database implementation. The diagram guides developers, helps communicate requirements, and ensures the platform supports all user workflows efficiently.
Key Concepts of ER Diagrams
ER Diagrams are the backbone of database design. They help you model how data elements interact. Here are the fundamental components:
- Entities: Objects or concepts with stored data (e.g., Farmer, Product, Order).
- Attributes: Data points about entities (e.g., Product Name, Order Date).
- Relationships: Connections between entities (e.g., a Farmer SUPPLIES Products).
- Primary Keys (PK): Unique identifiers for each entity (e.g., FarmerID).
- Foreign Keys (FK): Fields that create links between entities (e.g., Order includes RetailerID as FK).
For the Farm2Market system:
- A Farmer supplies multiple Products.
- A Retailer places multiple Orders.
- An Order includes one or more Products.
- Events are organized by Farmers and attended by Retailers.
These relationships form the structure for storing and retrieving information efficiently. A well-drawn ER Diagram prevents data redundancy and ensures integrity.
Basic Example:
Entity: Farmer
- FarmerID (PK)
- Name
- ContactInfo

Entity: Product
- ProductID (PK)
- Name
- Price
- FarmerID (FK)

Relationship: Farmer SUPPLIES Product
This simple model shows that each product must be linked to a farmer, ensuring traceability. As you scale up, similar logic helps keep relationships manageable and understandable.
Mastering these basics will make it easier to design your ER Diagram for more complex platforms like Farm2Market, which integrates marketplace operations with community-driven events.
Designing the ER Diagram for Farm2Market
Designing an ER Diagram involves several steps. Let’s break them down for the Farm2Market system.
Step 1: Identify Entities
Key entities include:
- Farmer
- Retailer
- Product
- Order
- OrderItem (junction for many-to-many Order–Product relationship)
- Delivery
- Payment
- Event
- EventRegistration
- Admin
Step 2: Define Attributes
- Farmer: FarmerID (PK), Name, Address, ContactInfo, FarmName
- Retailer: RetailerID (PK), Name, Email, Phone
- Product: ProductID (PK), Name, Category, Price, StockQty, FarmerID (FK)
- Order: OrderID (PK), RetailerID (FK), OrderDate, Status
- OrderItem: OrderItemID (PK), OrderID (FK), ProductID (FK), Quantity
- Delivery: DeliveryID (PK), OrderID (FK), DeliveryDate, Status
- Payment: PaymentID (PK), OrderID (FK), Amount, PaymentDate, Method
- Event: EventID (PK), Name, Type, Location, Date, OrganizerID (FK)
- EventRegistration: RegistrationID (PK), EventID (FK), RetailerID (FK)
- Admin: AdminID (PK), Username, Password, Role
Step 3: Establish Relationships
- A Farmer SUPPLIES Products
- A Retailer PLACES Orders
- Orders CONTAIN multiple Products (via OrderItem)
- Each Order HAS one Delivery and one Payment
- Farmers ORGANIZE Events
- Retailers REGISTER for Events
Step 4: Specify Constraints
- Each entity has a unique PK
- Relationships use FKs to maintain referential integrity
- Cardinalities:
- One Farmer supplies many Products (1:N)
- One Order has many OrderItems (1:N)
- Many Retailers can register for many Events (M:N via EventRegistration)
ERD Structure (Textual Description)
The Farm2Market ERD links producers, buyers, transactions, and community events. Entities are tightly connected through defined relationships, ensuring clear data flow from product listing to final payment and event participation.
ER Diagram Example
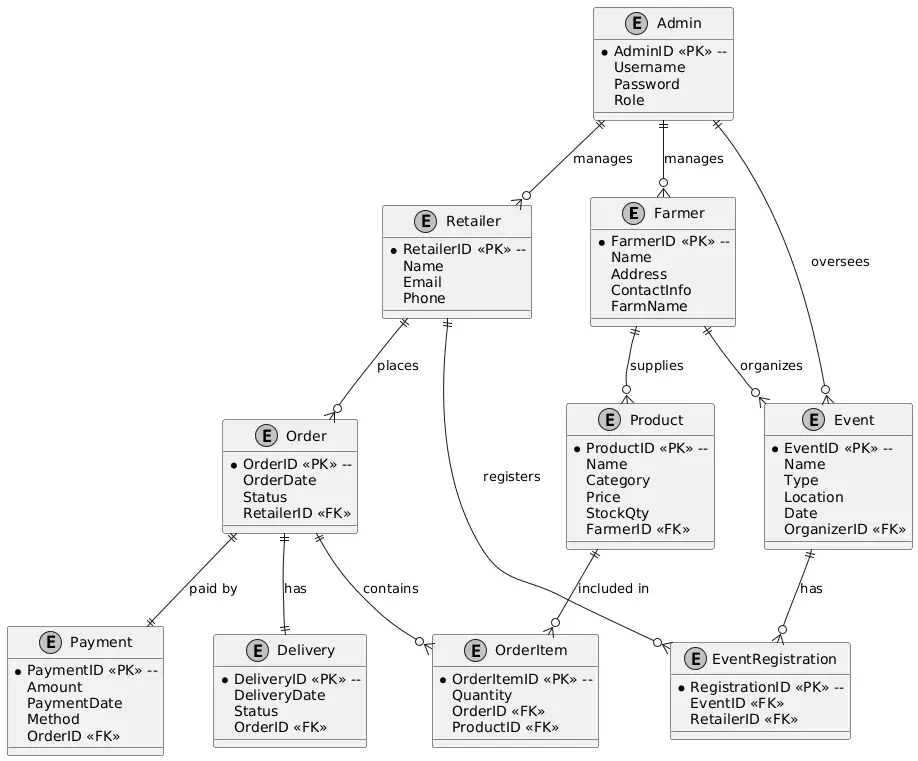
Let’s walk through the Farm2Market ER Diagram step-by-step.
Entities and Relationships:
- Farmer connects to Product through a one-to-many relationship.
- Retailer connects to Order, which links to OrderItem (for ordered products).
- OrderItem connects to Product, creating a many-to-many junction.
- Order links to Payment and Delivery, both in one-to-one relationships.
- Event is linked to Farmer as the organizer.
- Retailer joins EventRegistration, connecting to Event (many-to-many).
This structure ensures:
- Each farmer can manage products and events.
- Retailers have unique orders, deliveries, and event registrations.
- All transactions are traceable.
Domain-Specific Nuances:
- The inclusion of sports and cultural events allows event-based marketing.
- EventRegistration tracks attendees.
- Delivery and Payment entities ensure post-order processes are integrated.
If you’re building this in Lucidchart, Draw.io, or MySQL Workbench, you can use color codes or grouping to visually separate marketplace functions from event features.
PlantUML Script for Farm2Market ER Diagram
@startuml
' Avoid line intersections
skinparam monochrome true
skinparam ranksep 60
skinparam nodesep 50

entity "Farmer" {
* FarmerID <<PK>> --
Name
Address
ContactInfo
FarmName
}

entity "Retailer" {
* RetailerID <<PK>> --
Name
Email
Phone
}

entity "Product" {
* ProductID <<PK>> --
Name
Category
Price
StockQty
FarmerID <<FK>>
}

entity "Order" {
* OrderID <<PK>> --
OrderDate
Status
RetailerID <<FK>>
}

entity "OrderItem" {
* OrderItemID <<PK>> --
Quantity
OrderID <<FK>>
ProductID <<FK>>
}

entity "Delivery" {
* DeliveryID <<PK>> --
DeliveryDate
Status
OrderID <<FK>>
}

entity "Payment" {
* PaymentID <<PK>> --
Amount
PaymentDate
Method
OrderID <<FK>>
}

entity "Event" {
* EventID <<PK>> --
Name
Type
Location
Date
OrganizerID <<FK>>
}

entity "EventRegistration" {
* RegistrationID <<PK>> --
EventID <<FK>>
RetailerID <<FK>>
}

entity "Admin" {
* AdminID <<PK>> --
Username
Password
Role
}

Farmer ||--o{ Product : "supplies"
Retailer ||--o{ Order : "places"
Order ||--o{ OrderItem : "contains"
Product ||--o{ OrderItem : "included in"
Order ||--|| Delivery : "has"
Order ||--|| Payment : "paid by"
Farmer ||--o{ Event : "organizes"
Event ||--o{ EventRegistration : "has"
Retailer ||--o{ EventRegistration : "registers"
Admin ||--o{ Farmer : "manages"
Admin ||--o{ Retailer : "manages"
Admin ||--o{ Event : "oversees"

@enduml
Best Practices for Farm2Market ER Diagrams
Designing ER Diagrams for systems like Farm2Market requires clarity and scalability.
Best Practices:
- Normalize data: Remove redundancy (e.g., don’t repeat Farmer data in Product).
- Use junction tables: Simplify many-to-many relationships (e.g., OrderItem, EventRegistration).
- Apply meaningful names: Entity and attribute names should reflect real-world terms.
- Plan for future features: Leave room for features like product reviews or event ratings.
- Use consistent data types: Helps with compatibility and future migrations.
Common Pitfalls:
- Overcomplicating relationships: Avoid unnecessary intermediary tables.
- Missing keys: Always define primary and foreign keys explicitly.
- Neglecting events: Sports and cultural activities often get ignored but play a vital role in community-focused apps.
Recommended Tools:
- Lucidchart – Great for visual ERD design.
- ERDPlus – Good for students and academic projects.
- MySQL Workbench – Ideal for professional development tied to database engines.
Follow these best practices to ensure your diagram translates seamlessly into a working database.
Real-World Applications
An ER Diagram for Farm2Market serves as the blueprint for the system’s backend. Developers translate the ERD into SQL tables, constraints, and queries. This ensures data consistency, reliability, and scalability.
Applications:
- Farm management systems: ERDs define how farmer profiles, product stocks, and logistics are tracked.
- Order management: With entities like Order, OrderItem, and Delivery, it’s easy to monitor the order lifecycle.
- Event promotion: Cultural and sports events boost engagement; the Event and EventRegistration entities help coordinate these activities.
Industry Examples:
- AgriTech platforms like CropIn or DeHaat use similar database models.
- E-commerce hybrids such as Shopify for farm products need robust ER structures.
- Event-based marketplaces (like Eventbrite for farmers) also rely on ERDs to track participants, tickets, and organizers.
ERDs also support automation. For instance, a well-structured ER model makes it easier to implement:
- Auto-notifications for deliveries
- Event reminders
- Dynamic product updates
Case Study:
A university extension developed a farm marketplace that included online produce sales and live-streamed cultural shows. Their backend relied on a scalable ERD. By separating order data from event registrations, they achieved performance stability during high-traffic festivals.
This demonstrates the power of designing ERDs that reflect real-world dynamics and support diverse use cases.
Conclusion
The Farm2Market ER Diagram showcases how thoughtful data modeling can simplify complex systems. It connects farmers, retailers, products, and events under a unified structure that supports transactions, logistics, and community engagement.
By using ERDs, you define a system’s logic, reduce errors, and enhance communication among stakeholders. Whether you’re building an academic project or launching a startup, starting with a clear ERD gives your system a strong foundation.
I encourage you to experiment with ERD tools, adapt the provided PlantUML script, or create diagrams for similar domains like food delivery or local trade networks.
If this post helped you, let me know in the comments or check out the next guide in this series covering real-time inventory tracking using ERDs. Happy diagramming!
You may visit our Facebook page for more information, inquiries, and comments. Please subscribe also to our YouTube Channel to receive free capstone projects resources and computer programming tutorials.
Hire our team to do the project.