Livestock Management Application Entity Relationship Diagram
Introduction
Table of Contents
Livestock management is a vital component of modern agriculture, combining animal husbandry with data-driven operations. As farms grow more complex, so does the need to manage data on animals, breeding, feed, health, and production. Keeping track of this information manually is inefficient and error-prone. That’s where digital systems, backed by strong data structures, come into play.
At the heart of a well-structured database is the Entity Relationship Diagram (ERD). An ER Diagram helps visualize how data entities—like animals, feed types, or veterinary visits—relate to each other. By mapping out these relationships, developers and database designers can build systems that are logical, scalable, and maintainable.
This post will guide you through understanding and designing an ERD specifically for a Livestock Management Application. You’ll learn how to identify key entities and relationships in the livestock domain and how to represent them effectively. Whether you’re a student working on a capstone project, a developer building a livestock tracking app, or a database designer creating a system for a farm cooperative, this guide is tailored for you.
Our goal is to simplify ERD creation for this domain and help you build a solid foundation for any livestock-related database system. Let’s dive into the essential components and how they come together in an ER Diagram.
Overview of the Domain
Livestock management revolves around the breeding, feeding, health, and record-keeping of animals raised for agricultural purposes. Common components include animals, breeds, feed schedules, health check-ups, vaccination records, caretakers, and housing facilities. These aspects must be tracked meticulously to ensure animal welfare, optimize productivity, and comply with regulatory requirements.
Key processes in livestock systems include registering new animals, scheduling feeding routines, logging medical treatments, and monitoring growth rates. Each process generates data that must be managed securely and efficiently. For instance, each animal may have multiple health check records, various feeding schedules, and interactions with different caretakers.
One major challenge in this domain is maintaining up-to-date, accurate records without data duplication. ER Diagrams help solve this by clearly modeling how data entities connect. For example, instead of repeating animal details in every health record, a relationship links the “Animal” entity to the “Health Record” entity using a unique identifier.
Let’s consider a real-world use case: A mid-sized dairy farm wants to digitize its livestock operations. Each cow needs to be tracked from birth to retirement. The farm must log feed types, schedules, vaccinations, and breeding activities. Using an ER Diagram, the system design can ensure data consistency—like associating cows with their respective pens and recording who administered each vaccine.
By mapping out such interactions, developers gain a clear blueprint to build reliable and insightful applications that help farm owners make informed decisions.
Key Concepts of ER Diagrams
Before we dive into designing the ER Diagram for a Livestock Management Application, let’s recap the key building blocks of ERDs:
- Entities: Represent core components like “Animal”, “Feed”, or “Caretaker”.
- Attributes: Describe properties of entities, such as Animal ID, Birth Date, or Feed Type.
- Relationships: Show how entities are connected—e.g., an Animal receives Feed or undergoes Health Checkups.
- Primary Keys (PK): Uniquely identify each record in a table (e.g., AnimalID).
- Foreign Keys (FK): Link one entity to another using the PK of another table.
In livestock systems, these concepts become highly practical. For instance, the Animal entity may have attributes like AnimalID, Breed, and Gender. Each Feed Record would include the FeedID, Type, Quantity, and a Date. The relationship between Animal and Feed Record shows which animal consumed what type of feed and when.
A simplified version might look like this:
Entity: Animal
- AnimalID <<PK>>
- Breed
- Gender

Entity: FeedRecord
- FeedID <<PK>>
- AnimalID <<FK>>
- Type
- Quantity
- Date
Relationship: Animal "receives" FeedRecord (1-to-many)
This basic structure ensures each animal can have multiple feeding records, but every record links back to a specific animal. As your system grows, these foundations help maintain clarity and efficiency in data management.
Designing the ER Diagram for Livestock Management
Creating an ER Diagram for a Livestock Management System involves four key steps:
Step 1: Identify Entities
Main entities include:
- Animal
- Breed
- Feed
- FeedRecord
- HealthRecord
- Vaccine
- Caretaker
- Facility
- BreedingEvent
- Supplier
Step 2: Define Attributes
- Animal: AnimalID <>, BreedID <>, Gender, BirthDate, FacilityID <>
- Breed: BreedID <>, BreedName, Species
- Feed: FeedID <>, Name, Type, SupplierID <>
- FeedRecord: FeedRecordID <>, AnimalID <>, FeedID <>, Date, Quantity
- HealthRecord: HealthRecordID <>, AnimalID <>, CaretakerID <>, Date, Notes
- Vaccine: VaccineID <>, Name, Manufacturer
- Caretaker: CaretakerID <>, Name, Position, Contact
- Facility: FacilityID <>, Name, Location
- BreedingEvent: BreedingID <>, AnimalID <>, Date, Outcome
- Supplier: SupplierID <>, Name, ContactInfo
Step 3: Establish Relationships
- Animal belongs to one Breed
- Animal resides in one Facility
- FeedRecord links Feed and Animal
- HealthRecord links Animal and Caretaker
- Vaccine is recorded in HealthRecord
- Feed is provided by a Supplier
- Animal is involved in one or more BreedingEvents
Step 4: Specify Constraints
- Primary Keys ensure uniqueness.
- Foreign Keys maintain relationships between tables.
- Cardinalities:
- One Animal has many FeedRecords.
- One Breed maps to many Animals.
- One Caretaker may conduct many HealthRecords.
This structure supports scalability and integrity. The system avoids redundancy by storing repeated data—like breed info or caretaker details—in separate tables. Every record stays linked through clearly defined relationships.
ER Diagram Example
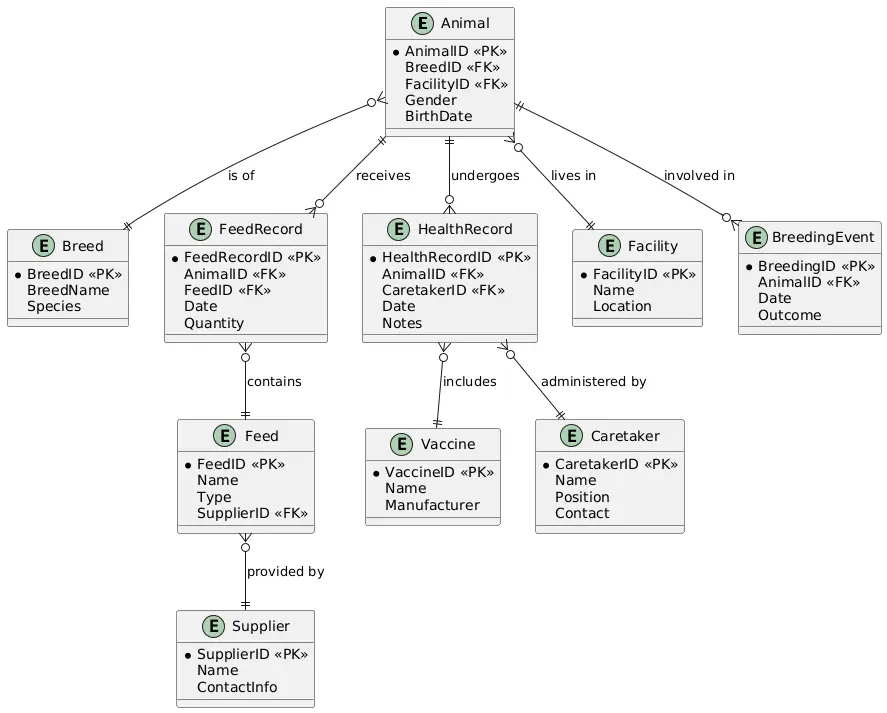
Here’s a conceptual walk-through of the ER Diagram for the Livestock Management Application:
- The Animal entity is central, linked to many tables: Breed, Facility, FeedRecord, HealthRecord, and BreedingEvent.
- Breed stores classification data like breed name and species, which avoids repeating these details across multiple animals.
- Feed and Supplier are linked, allowing tracking of feed origin and types.
- FeedRecord captures each feeding session, associating a feed with an animal and timestamp.
- HealthRecord logs care sessions, including treatment notes and caretaker information. It can optionally include Vaccine data.
- BreedingEvent records mating attempts or insemination procedures, their date, and outcome.
This layout ensures every entity serves a specific role while avoiding data repetition. For instance, if a feed type changes suppliers, only the SupplierID in the Feed table updates, preserving data consistency.
Each relationship is designed to reflect real-world scenarios:
- A cow may be fed different feed types daily.
- A caretaker may oversee multiple animals’ health.
- Facilities may host dozens of animals, categorized by purpose.
This ER Diagram structure enhances reporting, analytics, and mobile data entry for farmers or veterinarians.
PlantUML Script for Livestock Management ERD
Best Practices for Livestock ER Diagrams
When designing ERDs for livestock management, follow these best practices:
- Normalize Your Data: Store repeated info like breed or supplier details in separate tables. This reduces redundancy and improves scalability.
- Use Descriptive Names: Clearly name your entities and attributes to avoid confusion later.
- Capture Real Relationships: Reflect real-life operations such as feeding cycles or caretaker assignments through logical relationships.
- Validate Cardinalities: Make sure you define one-to-many or many-to-many relationships properly. Misusing these can lead to poor data integrity.
- Map Constraints Early: Assign primary and foreign keys during the design stage to maintain consistency.
- Use Tools That Support ERD Exporting: MySQL Workbench, ERDPlus, and Lucidchart help generate diagrams compatible with SQL implementations.
- Document Everything: Maintain clear documentation on each entity, especially for collaborative development.
Avoid These Pitfalls:
- Don’t store all attributes in one table (flat structures are inefficient).
- Avoid vague relationship definitions like “related to” or “connected with”.
- Don’t skip defining constraints; it weakens your data structure.
A good ER Diagram supports both current needs and future system expansion—whether you’re managing 100 or 10,000 animals.
Real-World Applications
ER Diagrams for livestock management serve as the blueprint for many agricultural and veterinary software solutions. These systems digitize manual processes and improve decision-making for farm owners, veterinarians, and agricultural technologists.
A real-world example: A goat farm wants to track health issues, feeding, and growth metrics. An ERD allows developers to create a database that logs each goat’s daily feed, vaccinations, and weight gains. Over time, analytics can reveal the best-performing feed types or flag recurring illnesses.
Industries and tools benefiting from such ERDs include:
- Agritech platforms like AgriWebb and FarmWizard, which help large-scale farms manage thousands of animals.
- Veterinary software that stores patient histories, care routines, and treatment schedules.
- Supply chain systems tracking feed deliveries and suppliers.
- Academic research using livestock databases for genetic and breeding studies.
For example, some government livestock tracking apps integrate ERD-driven databases to monitor disease outbreaks and maintain traceability. These systems connect entities like animals, health records, and geographic locations to visualize trends.
With an ERD in place, future enhancements—like mobile health logs or RFID tracking integration—become easier. Developers can extend the data model without disrupting existing records.
Ultimately, a well-designed ER Diagram isn’t just technical documentation—it’s a strategic asset that shapes how data flows across the livestock domain.
Conclusion
Entity Relationship Diagrams (ERDs) are critical tools in building efficient, reliable livestock management systems. By breaking down core components—like animals, health records, and feeding logs—into structured entities, developers and analysts can create scalable applications that mirror real-world operations.
This post walked you through the livestock domain, outlined how ERD concepts apply, and guided you through designing and visualizing a practical ER Diagram. Whether you’re working on a school project or building a production-level system, these fundamentals will help you organize data effectively.
Now it’s your turn: try drafting your own ERD using the steps and example provided. Explore the domain further by integrating IoT data or genetic tracking features into your design.
We’d love your feedback! Share your version of the livestock ERD or check out the next post in our series on Use Case Diagrams for IT projects.
You may visit our Facebook page for more information, inquiries, and comments. Please subscribe also to our YouTube Channel to receive free capstone projects resources and computer programming tutorials.
Hire our team to do the project.