Board Exam Reviewer Entity Relationship Diagram
Introduction
Table of Contents
The board exam reviewer domain is pivotal in education, enabling students to prepare effectively for high-stakes licensure and certification exams. Managing data in this domain—such as student profiles, exam questions, and review schedules—is essential for review centers, schools, and e-learning platforms. Efficient data management ensures seamless access to study materials, accurate tracking of progress, and personalized learning experiences. However, the complexity of handling diverse data points, from question banks to student performance metrics, demands a structured approach. This is where Entity Relationship Diagrams (ERDs) become indispensable.
An ERD is a visual tool that maps out entities (e.g., students, questions), their attributes (e.g., student ID, question difficulty), and relationships (e.g., a student answers a question). By providing a clear blueprint, ERDs guide the design of databases that are scalable, efficient, and easy to query. In the board exam reviewer context, ERDs help organize data to support features like adaptive testing, progress reports, and resource allocation, ensuring all components work harmoniously.
This post aims to demystify the process of creating an ERD for a board exam reviewer system. It offers a step-by-step guide, from identifying entities to defining relationships, complete with a practical example. The target audience includes database designers building educational platforms, developers integrating review tools, and students learning database concepts. Whether you’re new to ERDs or seeking domain-specific insights, this post provides actionable guidance to design a robust database tailored to board exam preparation, making data management both accessible and effective.
Overview of the Domain
The board exam reviewer domain encompasses key components like students, instructors, questions, subjects, review sessions, and performance records. Processes include creating question banks, scheduling review sessions, assigning instructors, and tracking student progress. For instance, a review platform might categorize questions by subject (e.g., Math, Science) and difficulty, assign them to students, and generate performance reports.
Data management challenges include maintaining question integrity, avoiding scheduling conflicts, and ensuring scalability for thousands of users. Without a structured database, issues like duplicate questions, inconsistent student records, or inefficient querying can arise. An ERD addresses these by defining clear relationships and constraints, enabling fast retrieval of data like “all questions answered by a student” or “sessions taught by an instructor.”
A real-world example is a review center preparing nurses for licensure exams. The center manages a database of students, instructors, and thousands of practice questions across subjects like Anatomy and Pharmacology. It schedules daily review sessions and tracks quiz scores to provide feedback. An ERD ensures that student data links to their quiz results, questions are tagged by subject, and sessions are assigned to qualified instructors, streamlining operations and enhancing the learning experience.
Key Concepts of ER Diagrams
An ER Diagram is built on fundamental concepts: entities, attributes, relationships, primary keys, and foreign keys. Entities represent objects like “Student” or “Question.” Attributes are details, such as a student’s “Name” or a question’s “Text.” Relationships describe interactions, like a student “takes” a quiz. Primary keys (e.g., StudentID) uniquely identify entities, while foreign keys (e.g., SubjectID in Question) link entities across tables.
In the board exam reviewer domain, entities include Student, Question, Subject, ReviewSession, and Quiz. For example, a Student has attributes like StudentID (PK), Name, and Email, while a Question includes QuestionID (PK), SubjectID (FK), and Difficulty. Relationships might include a Student “enrolls in” a ReviewSession or “answers” a Question via a Quiz. Cardinality defines these connections, such as one-to-many (one Subject has many Questions) or many-to-many (many Students take many Quizzes).
Simple Example:
- Entity: Student
- Attributes: StudentID (PK), Name, Email
- Relationship: Student ENROLLS_IN ReviewSession
This can be visualized as a box labeled “Student” with attributes inside, connected to a “ReviewSession” box via a line labeled “enrolls in.” Such diagrams clarify data structures, ensuring efficient database design for review systems.
Designing the ER Diagram for Board Exam Reviewer
Step 1: Identify Entities
Key entities include:
- Student
- Instructor
- Question
- Subject
- ReviewSession
- Quiz
- Answer
- Performance
- Category
- Schedule
Step 2: Define Attributes
- Student: StudentID (PK), Name, Email, Phone
- Instructor: InstructorID (PK), Name, Specialization
- Question: QuestionID (PK), SubjectID (FK), CategoryID (FK), Text, Difficulty
- Subject: SubjectID (PK), Name
- ReviewSession: SessionID (PK), InstructorID (FK), SubjectID (FK), Date, Time
- Quiz: QuizID (PK), StudentID (FK), Date
- Answer: AnswerID (PK), QuizID (FK), QuestionID (FK), Response
- Performance: PerformanceID (PK), StudentID (FK), QuizID (FK), Score
- Category: CategoryID (PK), Name
- Schedule: ScheduleID (PK), SessionID (FK), StartTime, EndTime
Step 3: Establish Relationships
- A Student ENROLLS_IN a ReviewSession.
- A Student TAKES a Quiz.
- A Question BELONGS_TO a Subject and Category.
- An Instructor TEACHES a ReviewSession.
- A Quiz CONTAINS Answers to Questions.
- A Performance TRACKS a Student’s Quiz results.
- A Schedule DEFINES a ReviewSession’s timing.
Step 4: Specify Constraints
- Primary keys (e.g., StudentID, QuestionID) ensure uniqueness.
- Foreign keys (e.g., SubjectID in Question) link entities.
- Cardinality:
- One Subject to many Questions (1:N).
- Many Students to many Quizzes (M:N, via Performance).
The ERD structure centers on Student and Question, connecting to ReviewSession, Quiz, and Performance for educational processes, with Subject, Category, and Schedule providing context.
ER Diagram Example
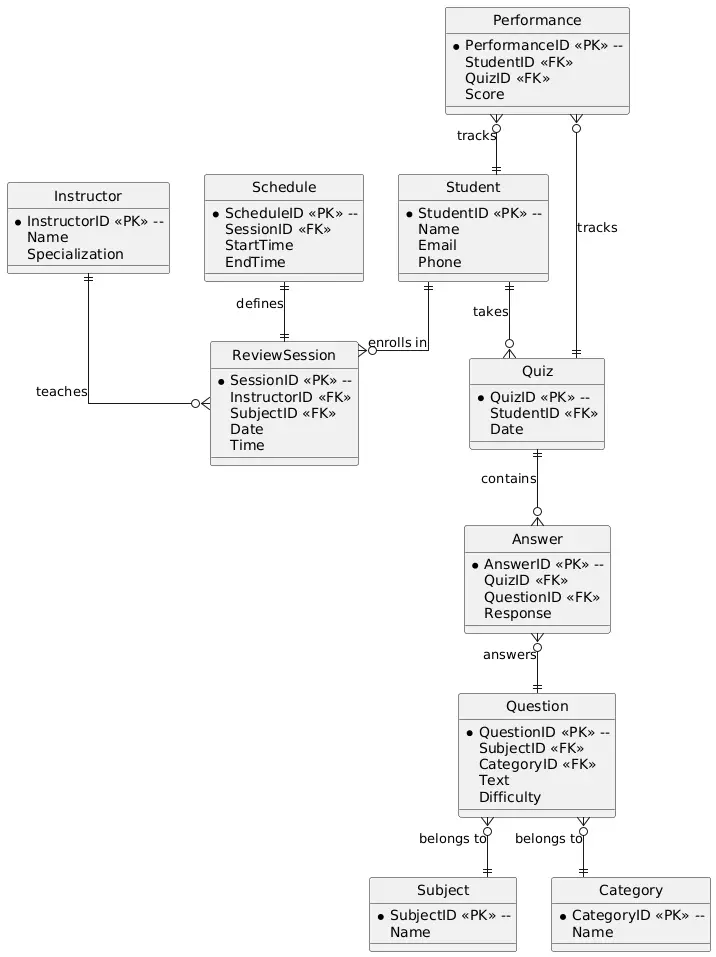
The ERD for a board exam reviewer system is described below, suitable for tools like Lucidchart or Draw.io.
Entities and Attributes:
- Student: StudentID (PK), Name, Email, Phone
- Instructor: InstructorID (PK), Name, Specialization
- Question: QuestionID (PK), SubjectID (FK), CategoryID (FK), Text, Difficulty
- Subject: SubjectID (PK), Name
- ReviewSession: SessionID (PK), InstructorID (FK), SubjectID (FK), Date, Time
- Quiz: QuizID (PK), StudentID (FK), Date
- Answer: AnswerID (PK), QuizID (FK), QuestionID (FK), Response
- Performance: PerformanceID (PK), StudentID (FK), QuizID (FK), Score
- Category: CategoryID (PK), Name
- Schedule: ScheduleID (PK), SessionID (FK), StartTime, EndTime
Relationships:
- Student ENROLLS_IN ReviewSession (many-to-many, via a junction table).
- Student TAKES Quiz (one-to-many).
- Instructor TEACHES ReviewSession (one-to-many).
- Question BELONGS_TO Subject and Category (many-to-one).
- Quiz CONTAINS Answers (one-to-many).
- Performance TRACKS Student and Quiz (many-to-one).
- Schedule DEFINES ReviewSession (one-to-one).
Walkthrough:
The Student entity is central, linking to Quiz (for assessments) and ReviewSession (for learning). Questions are categorized by Subject (e.g., Biology) and Category (e.g., Multiple Choice), ensuring flexible filtering. Instructors connect to ReviewSessions, while Schedules prevent conflicts. The Answer table stores student responses, and Performance calculates scores, enabling progress tracking.
Nuances:
- Question Management: Questions are tagged by difficulty and category for adaptive testing.
- Performance Tracking: The Performance table supports detailed analytics, like average scores per subject.
- Scheduling: Schedules ensure no overlapping sessions, critical for large review centers.
PlantUML Script for ERD
@startuml

' Hide the spot (circle) for primary keys
hide circle

' Use orthogonal lines for cleaner layout
skinparam linetype ortho

entity "Student" {
* StudentID <<PK>> --
Name
Email
Phone
}

entity "Instructor" {
* InstructorID <<PK>> --
Name
Specialization
}

entity "Question" {
* QuestionID <<PK>> --
SubjectID <<FK>>
CategoryID <<FK>>
Text
Difficulty
}

entity "Subject" {
* SubjectID <<PK>> --
Name
}

entity "ReviewSession" {
* SessionID <<PK>> --
InstructorID <<FK>>
SubjectID <<FK>>
Date
Time
}

entity "Quiz" {
* QuizID <<PK>> --
StudentID <<FK>>
Date
}

entity "Answer" {
* AnswerID <<PK>> --
QuizID <<FK>>
QuestionID <<FK>>
Response
}

entity "Performance" {
* PerformanceID <<PK>> --
StudentID <<FK>>
QuizID <<FK>>
Score
}

entity "Category" {
* CategoryID <<PK>> --
Name
}

entity "Schedule" {
* ScheduleID <<PK>> --
SessionID <<FK>>
StartTime
EndTime
}

' Relationships
Student ||--o{ Quiz : takes
Student ||--o{ ReviewSession : enrolls in
Instructor ||--o{ ReviewSession : teaches
Question }o--|| Subject : belongs to
Question }o--|| Category : belongs to
Quiz ||--o{ Answer : contains
Answer }o--|| Question : answers
Student ||--o{ Performance : tracked by
Quiz ||--o{ Performance : generates
Schedule ||--|| ReviewSession : defines

@enduml
Notes:
- Orthogonal lines (skinparam linetype ortho) prevent intersections.
- The Answer and Performance tables handle many-to-many relationships.
- All entities are interconnected, ensuring a cohesive system.
- Relationships are clearly labeled (e.g., “takes,” “teaches”).
Best Practices for Board Exam Reviewer ER Diagrams
To design effective ERDs for board exam reviewers, prioritize data normalization to eliminate redundancy—store question details once in the Question table, not in every Quiz. Use consistent naming (e.g., “StudentID” across tables) for clarity. Ensure scalability by indexing primary and foreign keys to handle large question banks or student cohorts.
Avoid common pitfalls like overcomplicating relationships. For example, don’t create separate tables for each question type; use a Category table instead. Neglecting cardinality can also cause issues, such as allowing a quiz to have no student. Always validate the ERD with sample queries, like “Retrieve all questions in a subject” or “List students in a session.”
Recommended tools include MySQL Workbench for professional-grade ERDs, Draw.io for quick diagramming, and ERDPlus for beginners. These tools support exporting and collaboration, streamlining the design process. Finally, test the ERD with realistic data to confirm it supports critical functions like progress tracking or question filtering.
Real-World Applications
The ERD for a board exam reviewer system powers real-world databases in educational platforms. For example, an e-learning app like Quizlet uses similar structures to manage question banks, track user quizzes, and schedule study sessions. The Question and Subject tables support content delivery, while Performance enables analytics like score trends.
Industries relying on such ERDs include edtech (e.g., Coursera), review centers, and university systems (e.g., Canvas). The ERD ensures data integrity—students can’t take the same quiz twice, and questions are correctly categorized. It also supports reporting, like generating performance dashboards or session attendance lists.
A case study might involve a medical review center using this ERD to manage licensure exam prep. The database streamlines question delivery, tracks student progress, and schedules instructor-led sessions, reducing administrative overhead and improving pass rates. Tools like PostgreSQL host the database, with front-end apps built in React for user interaction.
Conclusion
This post explored how to create an ERD for a board exam reviewer system, covering entities, relationships, and a detailed PlantUML script. The ERD simplifies data modeling by organizing students, questions, and sessions, addressing challenges like redundancy and scalability. Key takeaways include the importance of clear relationships, normalized data, and practical tools like MySQL Workbench.
Readers are encouraged to try designing their own ERD using Draw.io or ERDPlus. Explore related domains like e-learning or quiz apps to deepen your skills. Share your thoughts in the comments, check out our next post on database optimization, or visit resources like Coursera for more learning. Start building your ERD today!
You may visit our Facebook page for more information, inquiries, and comments. Please subscribe also to our YouTube Channel to receive free capstone projects resources and computer programming tutorials.
Hire our team to do the project.