Virtual Healthcare Assistant Dashboard using Hashbrown: Revolutionizing HealthTech with Generative UI
Table of Contents
- Virtual Healthcare Assistant Dashboard using Hashbrown: Revolutionizing HealthTech with Generative UI
- Introduction
- Background and Related Literature
- Problem Statement
- Project Objectives
- System Overview and Architecture
- Technology Stack
- Key Features of the System
- 1. AI-Powered Virtual Assistant
- 2. Generative UI Dashboard
- 3. Real-Time Health Monitoring
- 4. Doctor-Patient Interaction Panel
- 5. Predictive Analytics and Reports
- 6. Security and Privacy Compliance
- System Workflow
- Expected Outcomes
- Evaluation Metrics
- Challenges and Future Enhancements
- Summary and Conclusion
Introduction
In the digital era, healthcare is no longer confined to hospitals or clinics. Artificial Intelligence (AI), data visualization, and Generative User Interfaces (UI) have created new possibilities for accessible, intelligent, and patient-centered care. With the emergence of Hashbrown, a revolutionary Generative UI platform, developers can now create dynamic healthcare dashboards that adapt in real-time to patients’ data and doctors’ needs.
The traditional healthcare monitoring systems are often static and time-consuming to update. Doctors and patients face difficulties when navigating complex datasets or integrating real-time health information from wearables. A Virtual Healthcare Assistant Dashboard using Hashbrown bridges this gap by merging Generative UI design with AI-driven insights, allowing for a seamless experience where interfaces automatically evolve based on medical data and user interaction.
This project demonstrates how Hashbrown’s AI-powered interface generation can transform digital healthcare by creating adaptive, data-aware dashboards that make clinical decision-making faster, smarter, and more personalized.
Background and Related Literature
Healthcare dashboards have existed for decades, typically built with manual UI design tools and pre-defined layouts. While effective for static reporting, these systems struggle to handle dynamic, multi-source health data from wearables, IoT devices, and telemedicine services.
According to recent research, medical professionals increasingly rely on real-time visualization systems for diagnosis and monitoring. However, these dashboards require continuous redesign as new data types or analytics models are introduced. This process is both time-consuming and prone to human error.
Generative UI—the ability for software to design and adapt interfaces autonomously—addresses this limitation. Platforms like Hashbrown use natural language prompts and structured data to generate UI components instantly. In healthcare, this enables smart dashboards that adjust layouts, charts, and interaction panels automatically, making data visualization more responsive and context-aware.
Previous studies on AI-driven healthcare assistants (e.g., IBM Watson Health, Babylon AI) focus mainly on chat interfaces or predictive analytics. This project goes further by combining AI reasoning with generative visualization, empowering both patients and practitioners through adaptive dashboards.
Problem Statement
Traditional healthcare systems suffer from three major challenges:
- Static Dashboards: Fixed layouts that fail to adapt to changing medical data or user needs.
- Manual Updates: Every interface change requires developer intervention, delaying critical updates.
- Limited Personalization: Dashboards rarely adapt to a patient’s unique health context or a doctor’s specialty.
The Virtual Healthcare Assistant Dashboard using Hashbrown addresses these gaps by creating a Generative UI system that dynamically constructs dashboards and visualizations in real-time, integrating AI insights and health data automatically.
Project Objectives
This project aims to design a Virtual Healthcare Assistant Dashboard that leverages Hashbrown’s Generative UI capabilities to enhance medical data accessibility and user experience. Specifically, it seeks to:
- Build an intelligent dashboard that automatically adapts to incoming health data.
- Integrate AI-driven insights for personalized patient monitoring and diagnosis support.
- Enable two-way communication between patients and doctors through a virtual assistant.
- Enhance healthcare efficiency through data visualization and predictive analytics.
- Demonstrate how Generative UI reduces development time for healthcare systems.
System Overview and Architecture
The system architecture consists of four main layers:
- Input Layer – Collects patient data from wearables, medical devices, and manual input.
- Processing Layer – Runs AI models to analyze symptoms, predict risks, and generate recommendations.
- Generative UI Layer – Powered by Hashbrown, this layer dynamically generates or updates dashboard components.
- Output Layer – Displays adaptive dashboards, analytics visualizations, chatbot communication, and alerts.
Workflow Example:
- A patient connects a wearable device that records heart rate and blood oxygen levels.
- The backend AI processes the data and identifies abnormal readings.
- Hashbrown auto-generates a new widget on the dashboard to display an alert.
- The virtual assistant notifies the doctor and provides a visual summary.
This architecture demonstrates how automation and adaptability enhance real-time healthcare delivery.
Technology Stack
| Layer | Tools / Frameworks | Description |
|---|---|---|
| Generative UI | Hashbrown | Automates creation of dashboards, charts, and components |
| Frontend | React.js / Vue.js | Provides the structure for generated UI elements |
| Backend | Flask (Python) / Node.js | Handles data processing and AI model integration |
| Database | MongoDB / MySQL | Stores patient data and medical records |
| AI Engine | OpenAI API / TensorFlow | Supports natural language reasoning and prediction |
| Visualization | Chart.js / D3.js | Renders dynamic health data visualizations |
| Security | JWT / OAuth 2.0 | Ensures secure login and role-based access |
| Hosting | Firebase / AWS | Deploys the web application securely |
This stack balances innovation and scalability, allowing seamless integration between AI reasoning, Generative UI, and healthcare data systems.
Key Features of the System
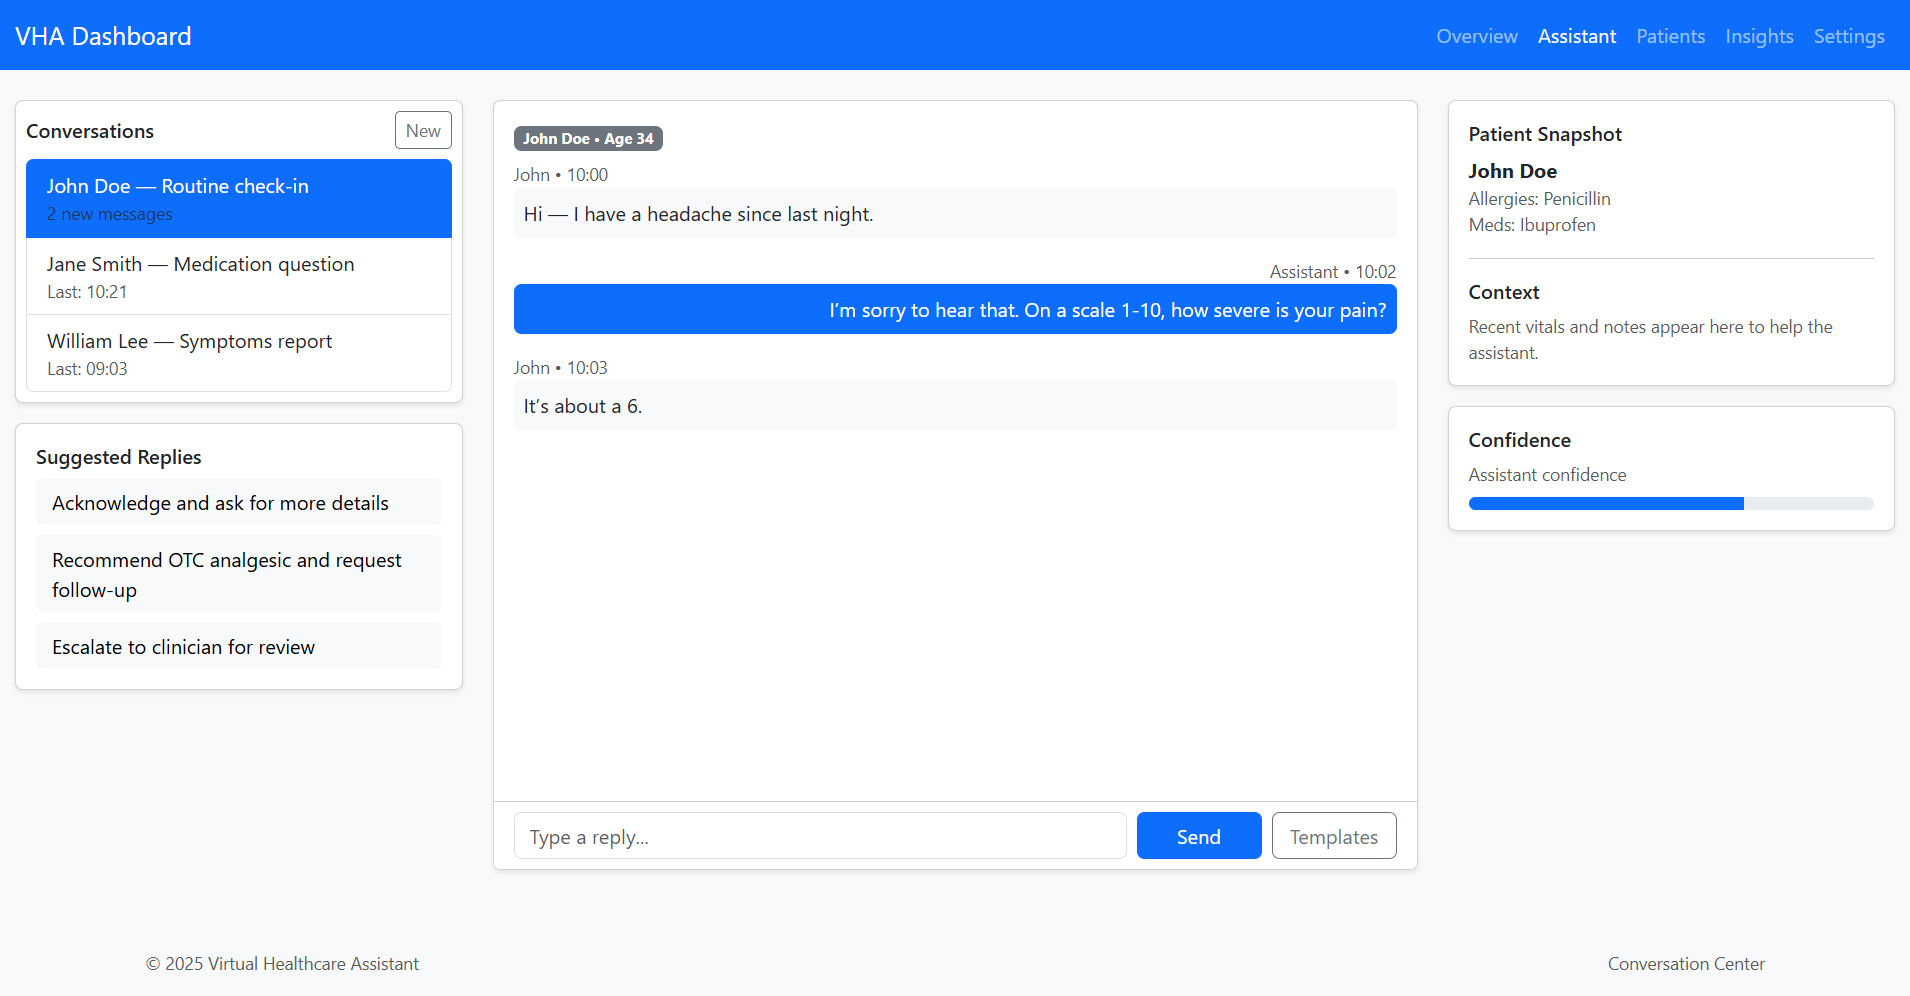
1. AI-Powered Virtual Assistant
The built-in chatbot interacts with patients to gather symptoms, track health status, and provide personalized feedback. It uses OpenAI API for contextual responses and integrates with the dashboard to display relevant visual data.
2. Generative UI Dashboard
Using Hashbrown, the dashboard automatically constructs panels, charts, and cards based on data streams. For example, when a new health metric (e.g., blood pressure) is introduced, Hashbrown generates a new visualization component instantly.
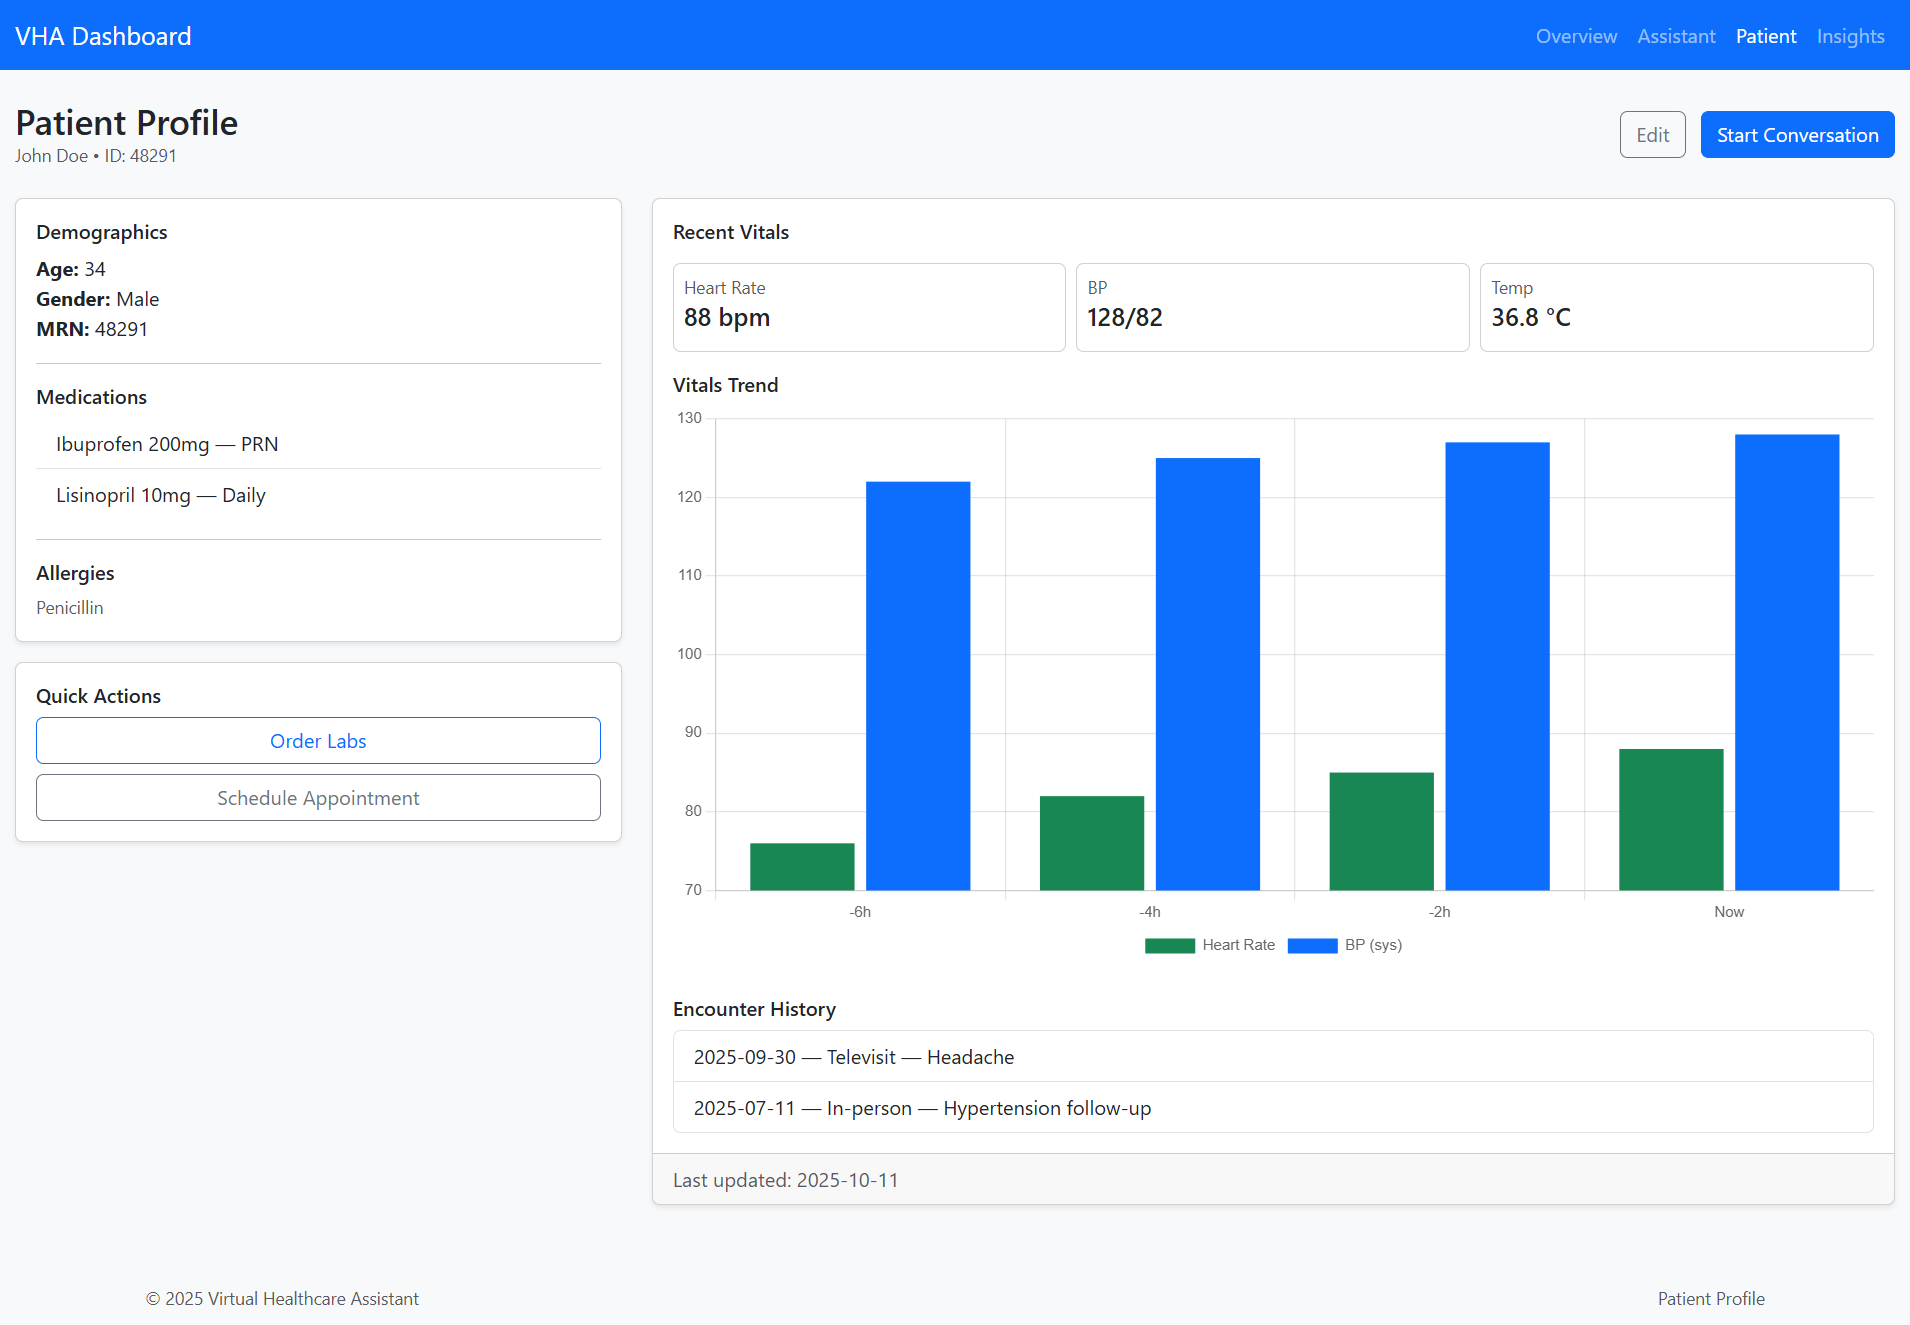
3. Real-Time Health Monitoring
Integrates with IoT wearables (like Fitbit or Apple Watch) to display live readings of heart rate, oxygen level, and temperature. It also detects anomalies and displays alerts dynamically.
4. Doctor-Patient Interaction Panel
A secure communication channel where doctors can monitor patients remotely, send advice, and adjust treatment plans directly on the dashboard.
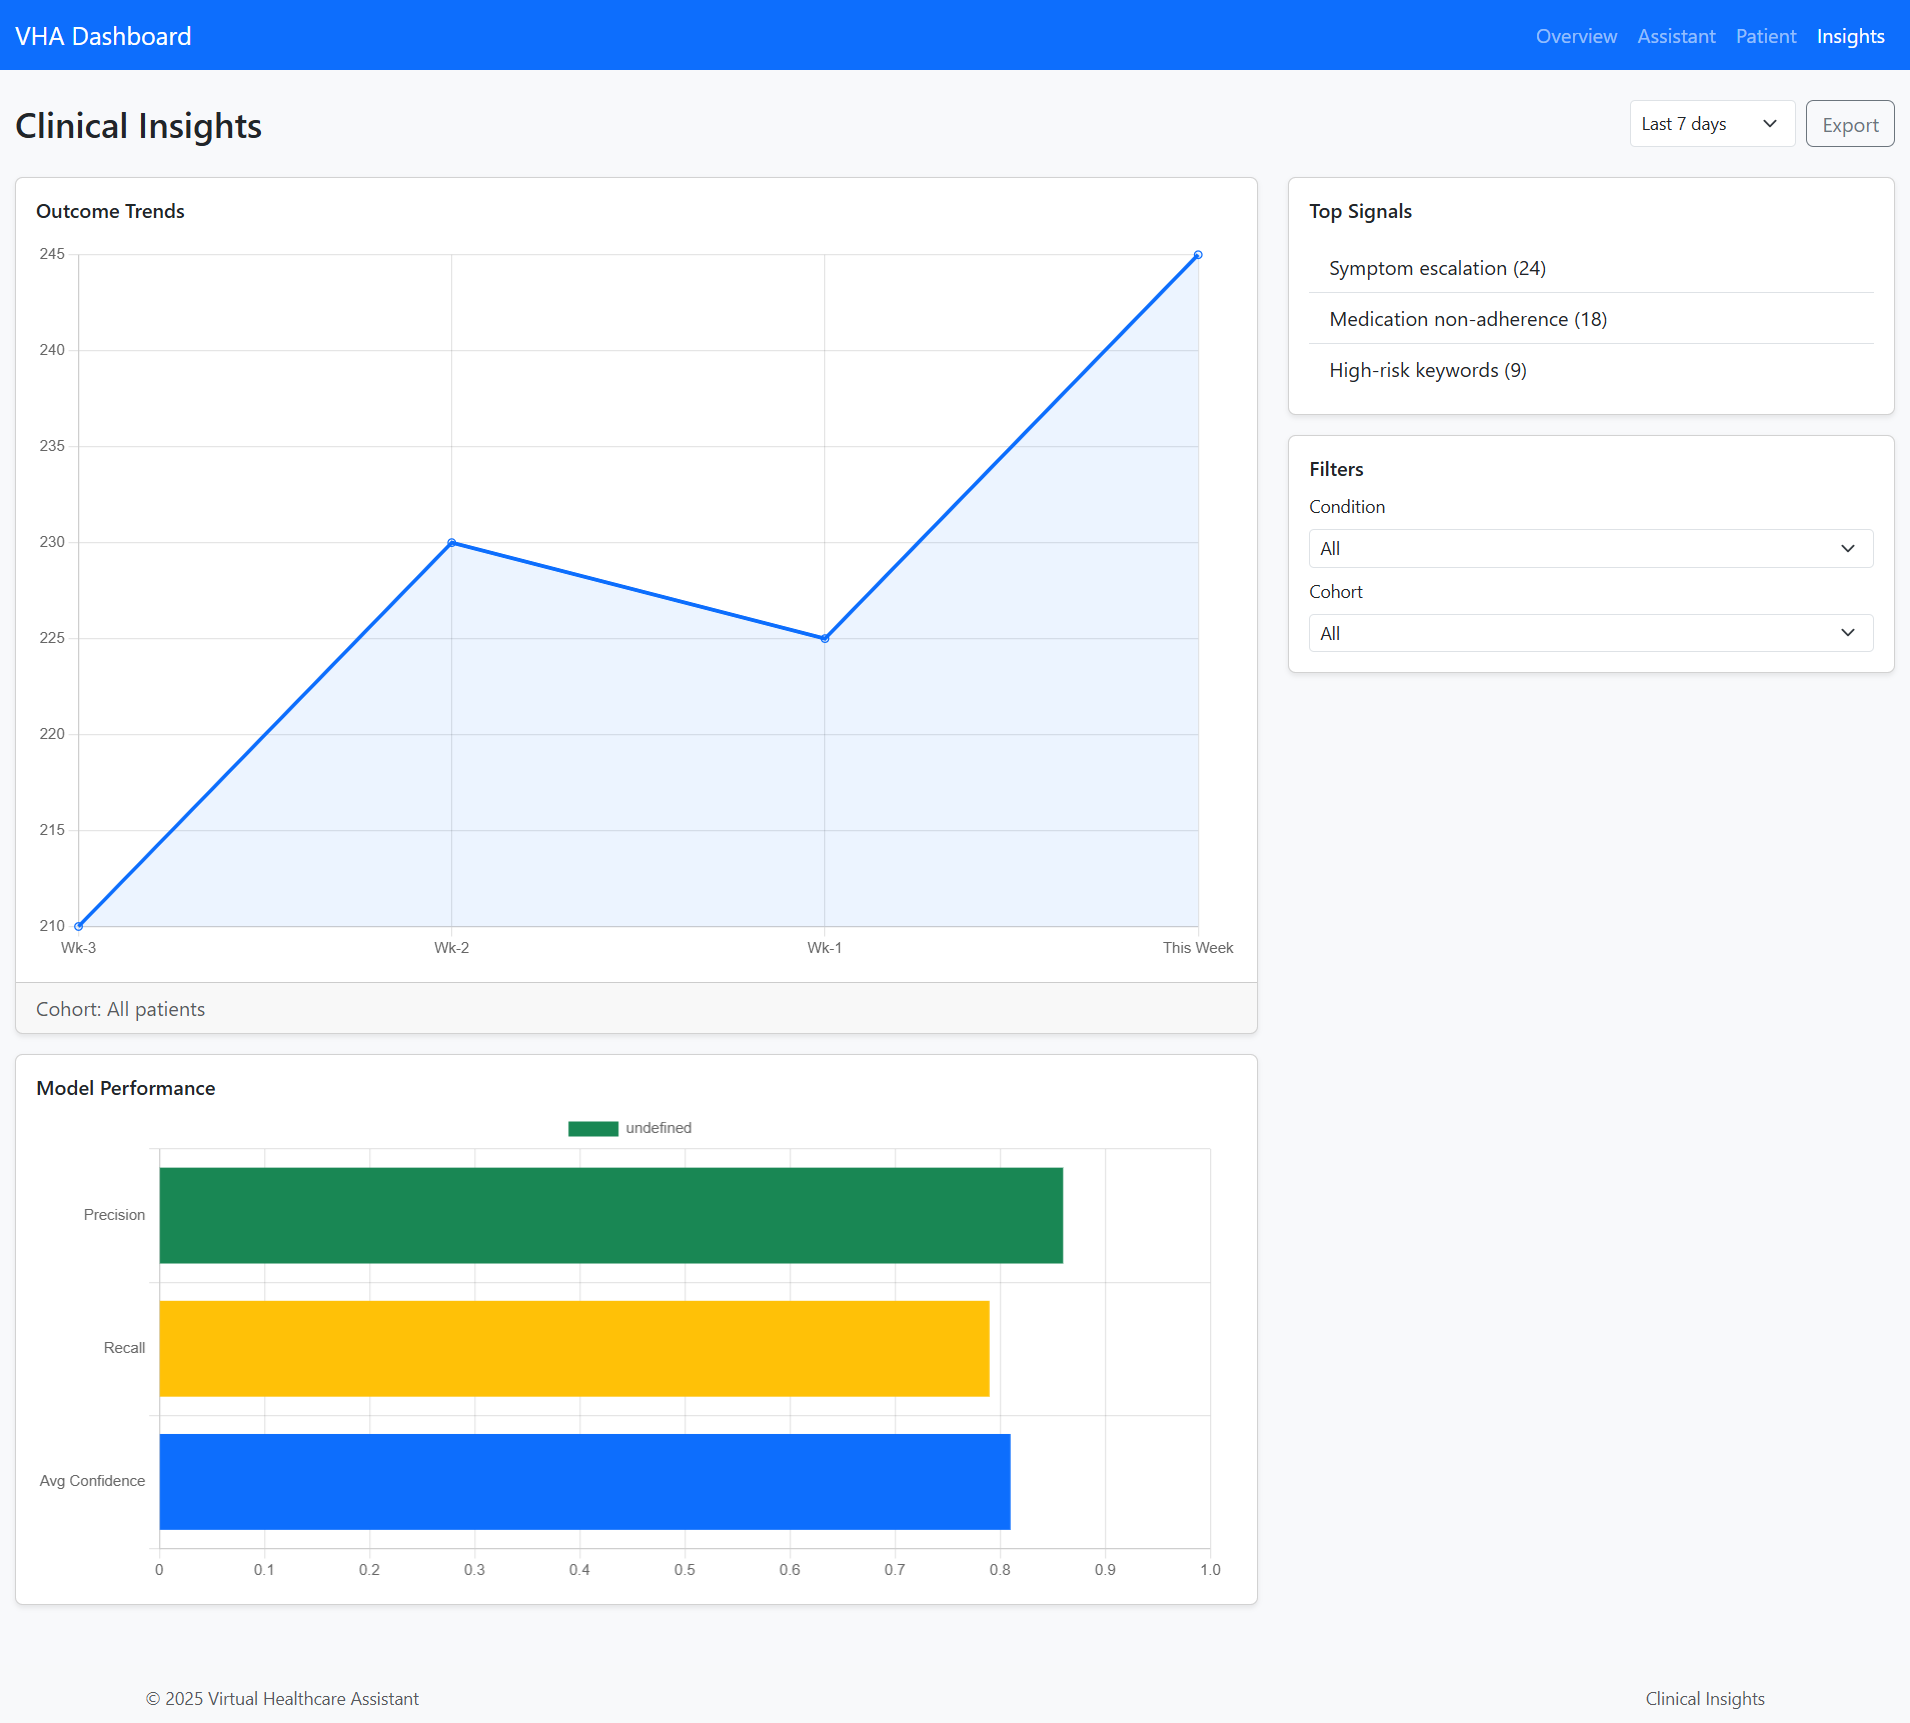
5. Predictive Analytics and Reports
AI models forecast possible health risks, such as high blood pressure trends or glucose fluctuations. These predictions are visually represented through auto-generated charts.
6. Security and Privacy Compliance
All data is encrypted, and access is role-based to comply with HIPAA and other healthcare data privacy standards.
System Workflow
- Patient Login: The patient logs in and connects wearable devices or manually enters symptoms.
- Data Collection: Real-time metrics are sent to the backend via APIs.
- AI Processing: Models analyze trends, predict risks, and generate insights.
- Generative UI Response: Hashbrown dynamically updates or creates dashboard widgets.
- Virtual Assistant Interaction: Provides recommendations or alerts through natural language.
- Doctor Review: The doctor views reports and communicates recommendations via the dashboard.
This workflow highlights the real-time adaptability and automation that define Hashbrown’s role in healthcare innovation.
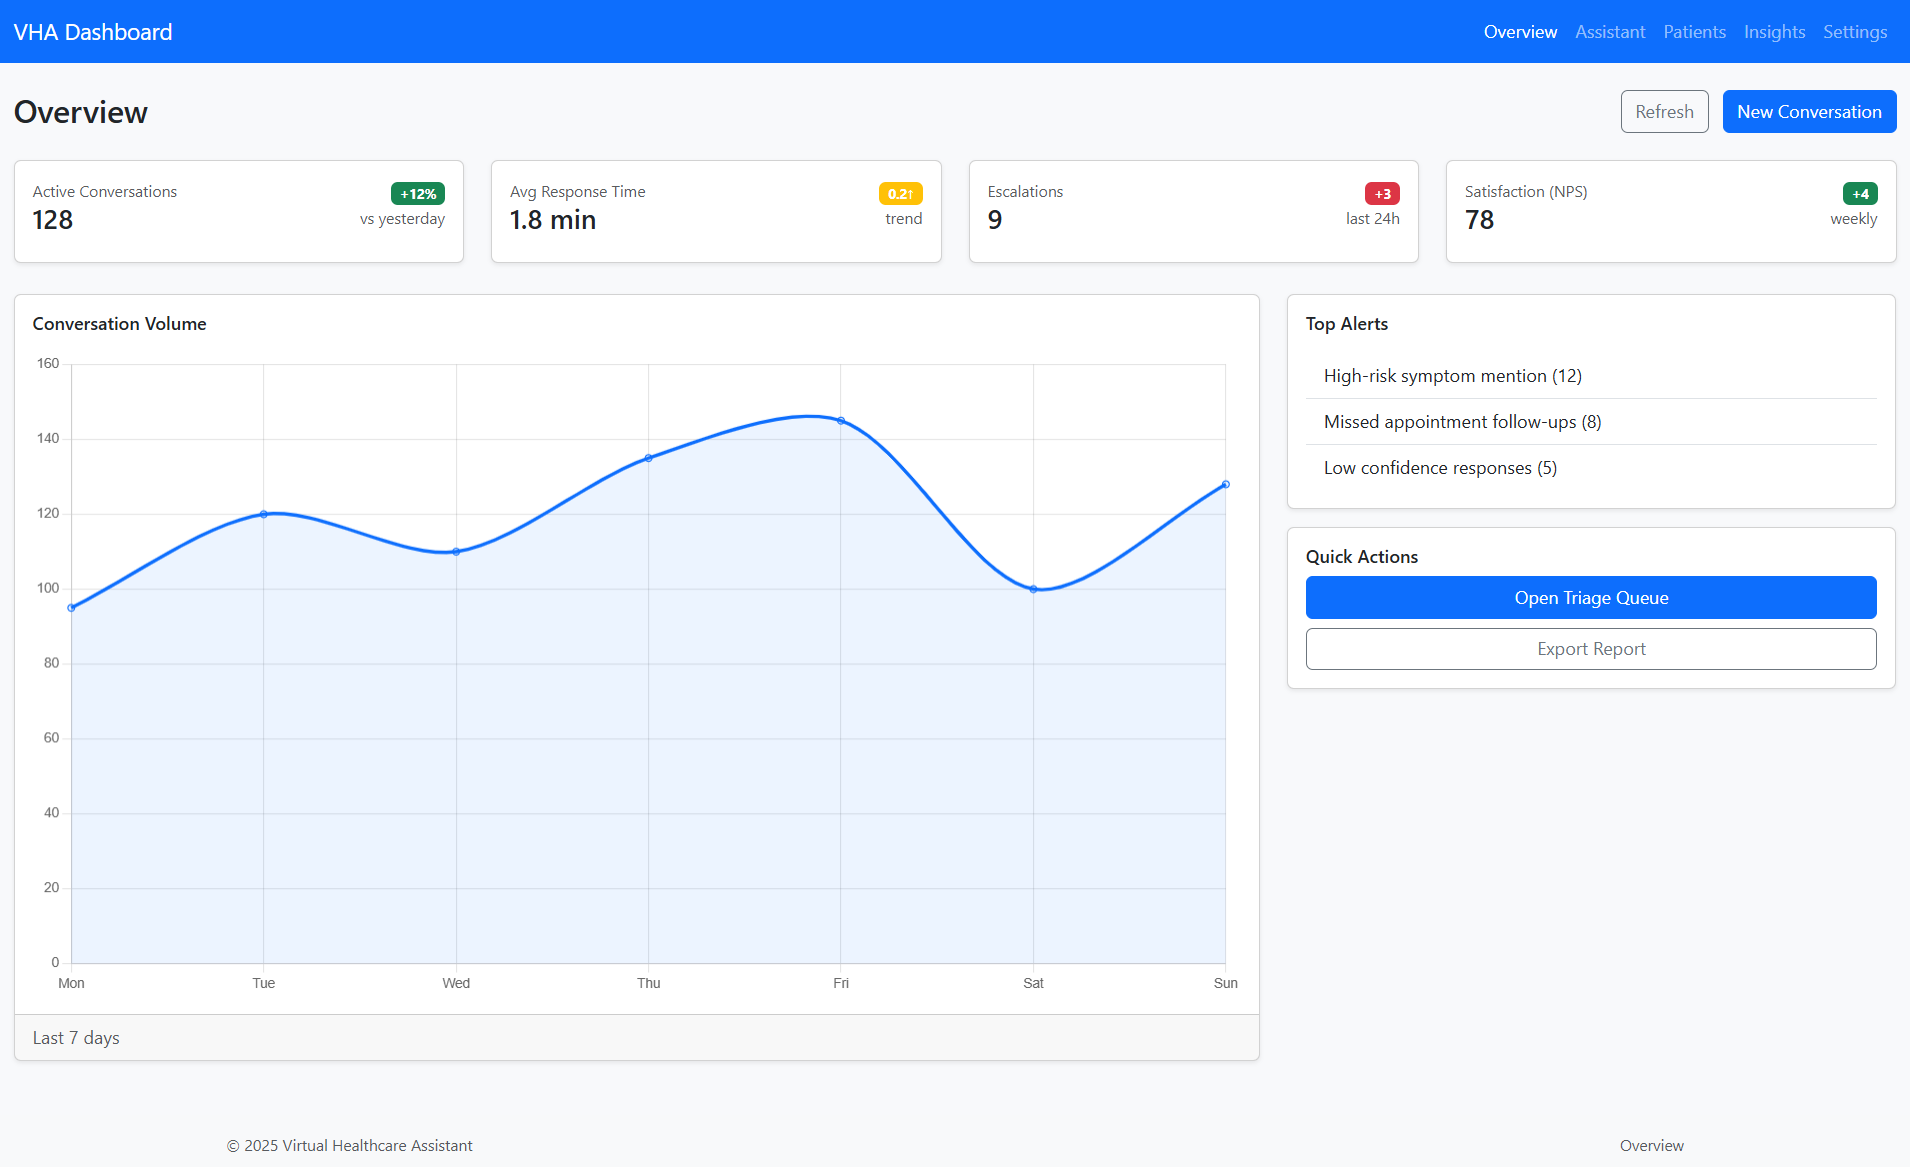
Expected Outcomes
The Virtual Healthcare Assistant Dashboard aims to deliver:
- A dynamic, self-updating interface that evolves with patient data.
- Enhanced clinical decision-making through visual AI insights.
- Improved patient engagement via interactive, personalized dashboards.
- Reduced UI development time and faster deployment cycles for healthcare tech startups.
- Scalable architecture applicable to telemedicine platforms and remote health monitoring systems.
Evaluation Metrics
To measure the effectiveness of the system, the following metrics are used:
- Response Time: Speed of UI generation and data visualization.
- Accuracy: Precision of AI predictions and health insights.
- Usability: User satisfaction and ease of navigation.
- Reliability: Uptime and stability of real-time data streams.
- Security: Effectiveness of access control and encryption protocols.
These criteria ensure that the system is not only intelligent but also safe and user-centered.
Challenges and Future Enhancements
Despite its advantages, the project faces certain challenges:
- Integration complexity: Combining Generative UI with sensitive medical data requires robust validation.
- AI interpretability: Ensuring explainable predictions is essential for clinical acceptance.
- Data privacy laws: Systems must adhere to local and international data protection regulations.
- Continuous learning: Future versions may integrate reinforcement learning for adaptive interface behavior.
Future work will explore multi-language AI assistants, emotion-based response adaptation, and cross-device dashboard synchronization to create a more inclusive and intelligent health platform.
Summary and Conclusion
The Virtual Healthcare Assistant Dashboard using Hashbrown represents a milestone in healthcare technology. It merges Generative UI innovation with AI-driven patient support, offering a smarter, more flexible, and efficient solution to health data visualization and management.
Unlike conventional dashboards, this system can evolve autonomously—adding or rearranging components as new information arrives. By empowering doctors with real-time analytics and offering patients interactive monitoring tools, it bridges the communication gap in modern healthcare.
As generative technologies mature, Hashbrown and similar tools will redefine how healthcare systems are designed—turning static dashboards into living, learning interfaces that adapt to every heartbeat, every patient, and every decision.
You may visit our Facebook page for more information, inquiries, and comments. Please subscribe also to our YouTube Channel to receive free capstone projects resources and computer programming tutorials.
Hire our team to do the project.