Visitor Log Monitoring System ER Diagram
This article will discuss the step by step process on how to prepare the entity relationship diagram or ERD of the project entitled Visitor Log Monitoring System.
The capstone project entitled Visitor Log Monitoring System is a simple attendance system intended to record the visitor in the BJMP or the Bureau of Jail Management and Penology. It is a computer based system that records the information of the inmates, visitors and archives the visit log for reporting purposes.
The first step in the development of the Visitor Log Monitoring System is to prepare the ER diagram that will serve as the basis later on in the creation of the actual database.
We will create and explain the process of making the entity relationship diagram of Visitor Log Monitoring System.
Let’s start from the symbols used in the ER Diagram.
Entity is represented by the rectangle shape. The entity will be our database table of Visitor Log Monitoring System later on.
Attribute is represented by the oval shape. This will be the columns or fields of each table in the Visitor Log Monitoring System.
Relationship is represented by diamond shape. This will determine the relationships among entities. This is usually in a form of primary key to foreign key connection.
We will follow the 3 basic rules in creating the ER Diagram.
- Identify all the entities.
- Identify the relationship between entities and
- Add meaningful attributes to our entities.
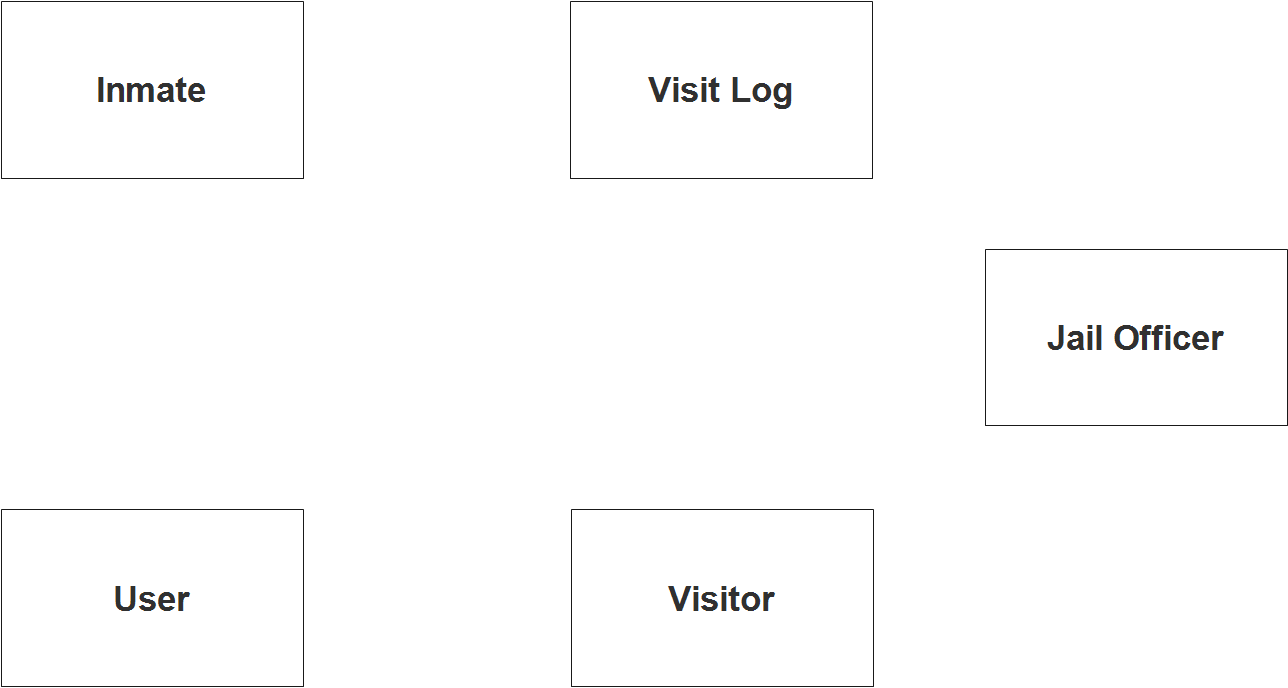
Step 1. In the Visitor Log Monitoring System we have the following entities
- User
- Inmate
- Visitor
- Visit Log
- Jail Officer
Our design of Visitor Log Monitoring System consists of 5 entities; the specified entities will be our database tables in the design and implementation of Visitor Log Monitoring database schema.
We will now draw the entities of the Visitor Log Monitoring System specified above and it will be represented by a rectangle shape. The image below is the entities identified in the scope of the Visitor Log Monitoring System.
Step 2. After we have specified our entities, it is time now to connect or establish a relationship among the entities.
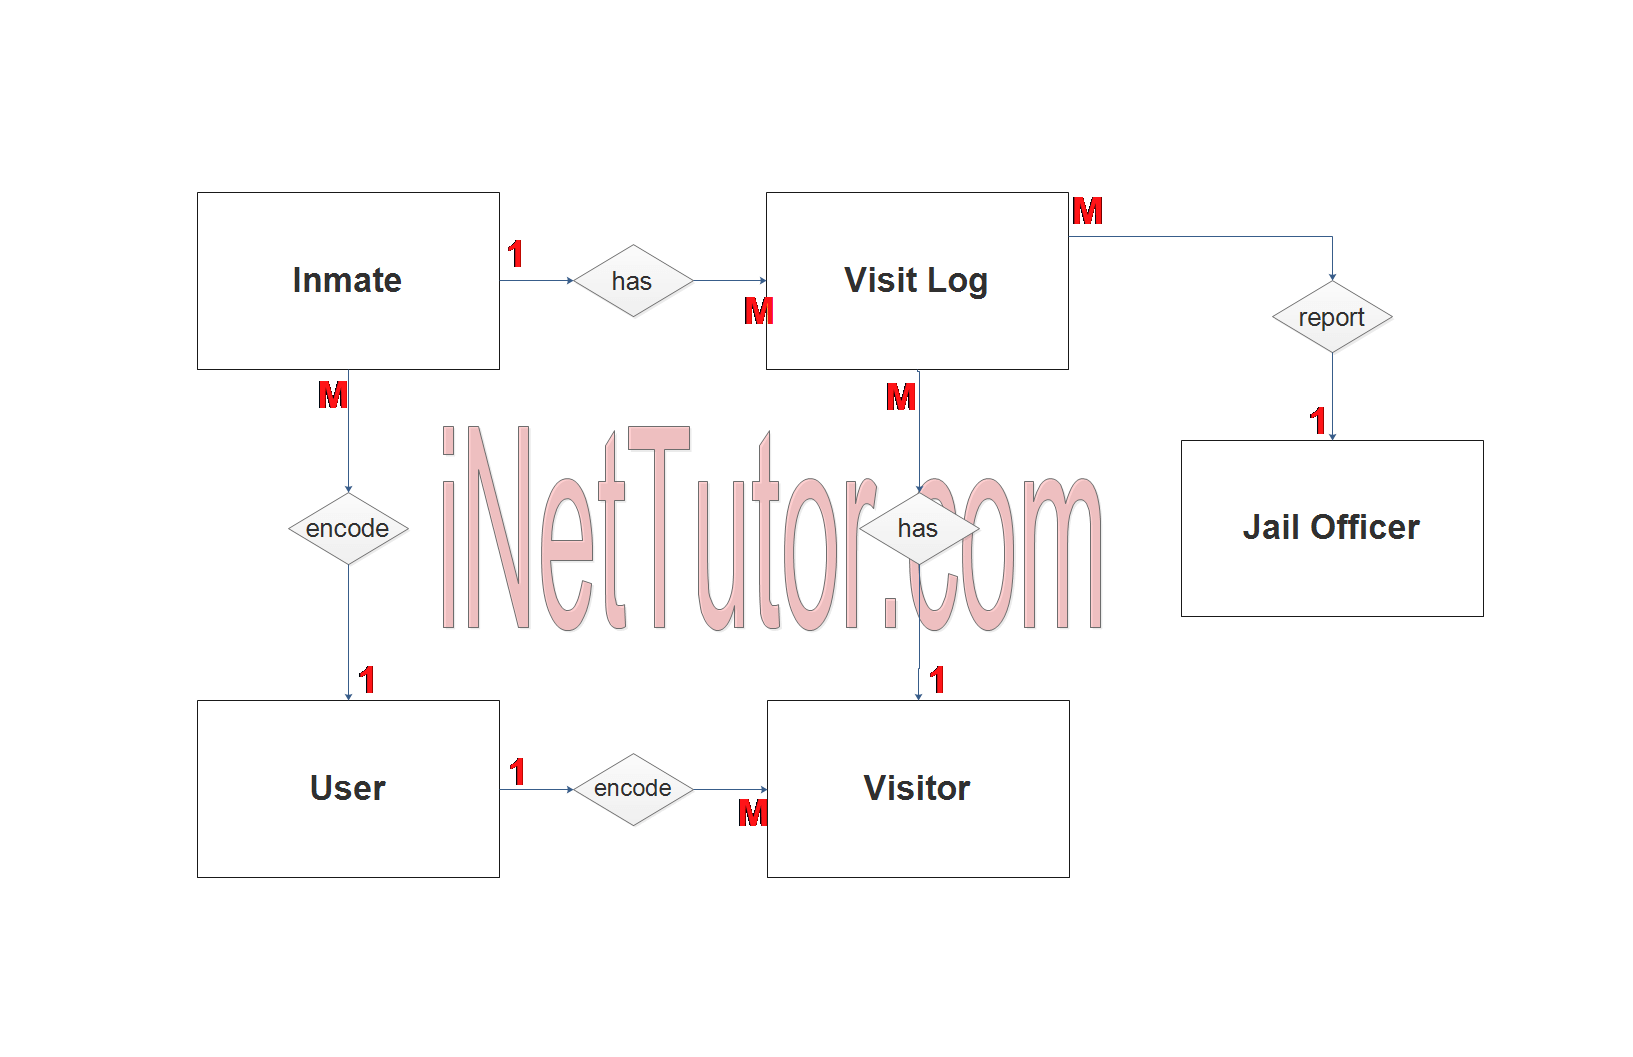
- The user encode/manage/update the visitor information (1 to many relationship).
- The user encode/manage/update the inmate information (1 to many relationship).
- Visitor visits an inmate and the system records the visit and stores in the visit log (1 to many relationship).
- Inmate has visitors and also recorded in the visit log (1 to many relationship).
- Jail officer compiles the report (1 to many relationship).
Step 3. The last part of the ERD process is to add attributes to our entities.
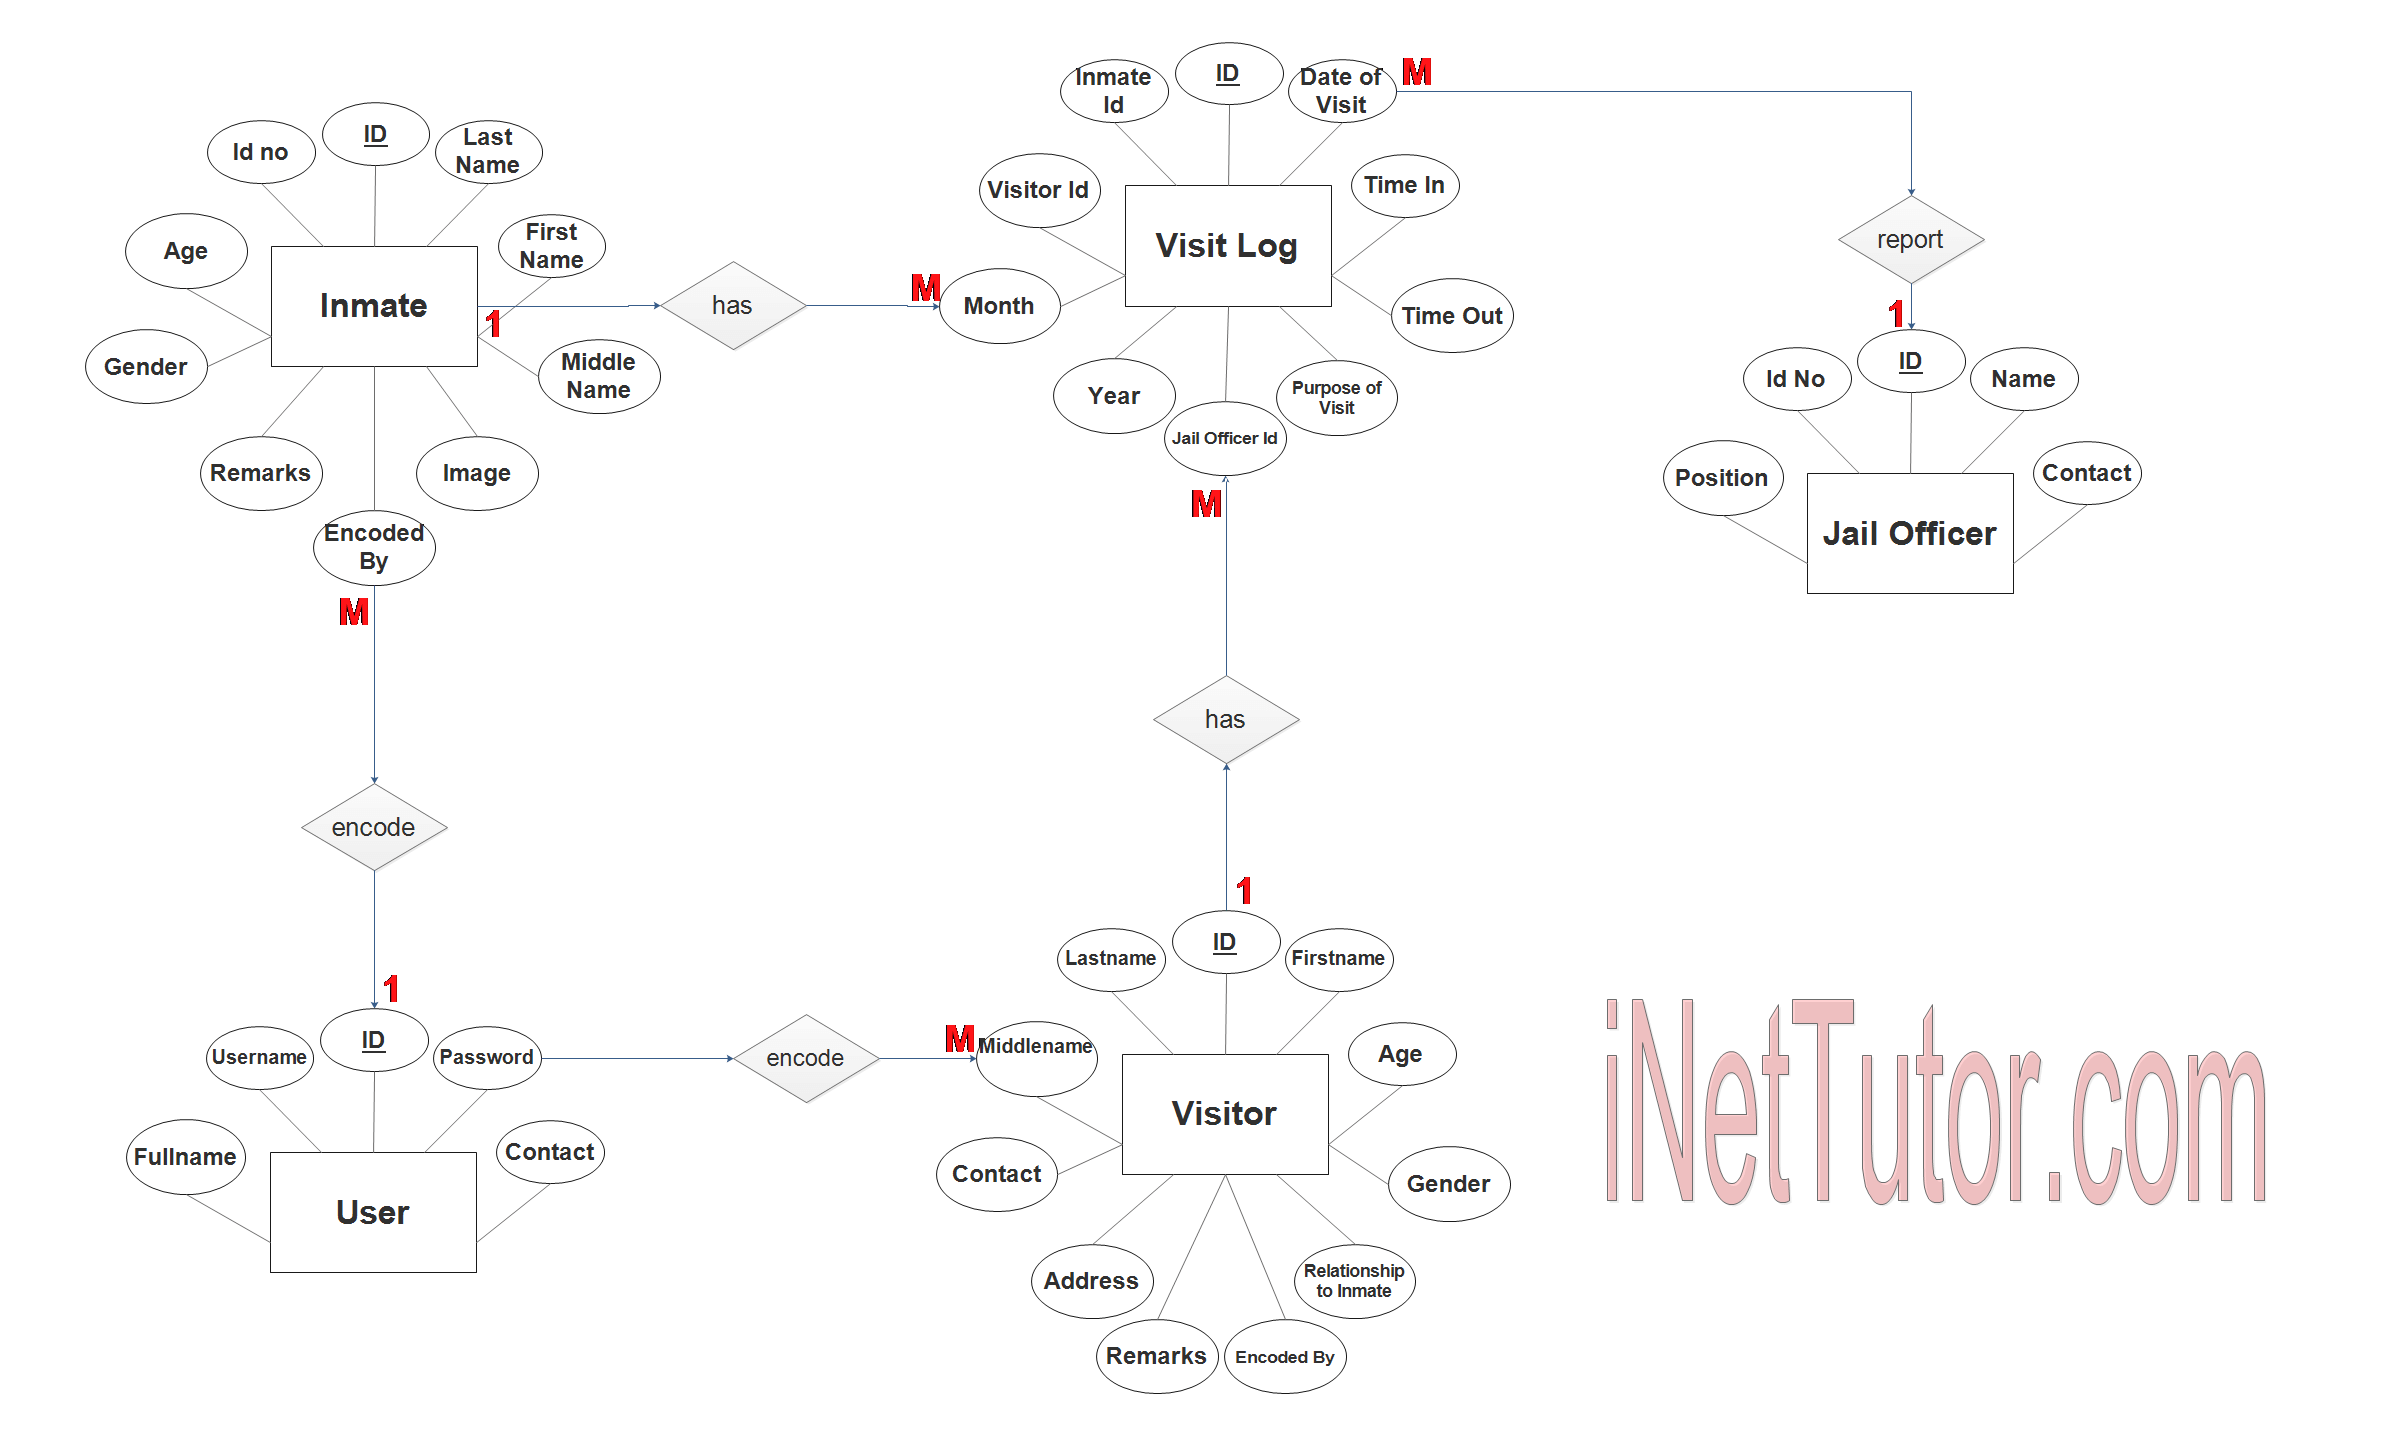
User Entity has the following attributes:
- ID – primary key represented with underline
- Fullname
- Username
- Password
- Contact
Inmate Entity has the following attributes:
- ID – primary key represented with underline
- ID No
- Firstname
- Lastname
- Middlename
- Age
- Gender
- Image
- Remarks
- Encoded by – foreign key
Visitor Entity has the following attributes:
- ID – primary key represented with underline
- Firstname
- Lastname
- Middlename
- Contact
- Age
- Address
- Gender
- Relationship to Inmate
- Remarks
- Encoded by – foreign key
Visit Log Entity has the following attributes:
- ID – primary key represented with underline
- Date of visit
- Inmate ID – foreign key
- Visitor ID – foreign key
- Time in
- Time out
- Month
- Year
- Purpose of visit
- Jail Officer ID – foreign key
Jail Officer Entity has the following attributes:
- ID – primary key represented with underline
- ID No
- Name
- Position
- Contact
Note: all attributes with underline represents the primary key of the entity or table.
The next step is to convert the plan designed on ER Diagram into the actual database, please search for the Visitor Log Monitoring System article which was already posted.
Contact us on our facebook page for the softcopy of the Visitor Log Monitoring System.
You may visit our facebook page for more information, inquiries and comments.
Hire our team to do the project.