Online Skill sharing Marketplace Entity Relationship Diagram
Introduction
Table of Contents
The Online Skill-sharing Marketplace is a dynamic platform where experts teach skills, from coding to yoga, including sports and cultural events like dance workshops or marathon coaching. Efficient data management is crucial to track users, courses, bookings, and events, ensuring seamless operations. An Entity Relationship (ER) Diagram is a vital tool in designing databases for such platforms, visually mapping entities, attributes, and relationships to create a structured, scalable system.
ER Diagrams simplify complex interactions, such as connecting instructors to courses or participants to events, ensuring data integrity and optimized queries. This post guides readers through creating an ER Diagram for an Online Skill-sharing Marketplace, incorporating sports and cultural events. It targets database designers, developers, students, and platform administrators seeking to model data effectively.
By exploring entities like Users, Courses, and Events, defining their attributes, and establishing relationships, you’ll learn to build a robust database. The guide includes a PlantUML script for a clear, non-intersecting ER Diagram, best practices, and real-world applications. Whether you’re designing a skill-sharing app or managing event logistics, this post equips you with the knowledge to create an efficient database, streamlining operations and enhancing user experiences.
Overview of the Domain
An Online Skill-sharing Marketplace connects instructors with learners, offering courses on diverse skills, including sports (e.g., tennis coaching) and cultural events (e.g., pottery workshops). Key components include Users (instructors and learners), Courses, Bookings, Payments, Events, Venues, and Reviews. For sports and cultural events, additional entities like Participants and Tickets manage attendance and logistics. These components generate vast data—course schedules, user profiles, payment records, and event details—that require organized storage.
Data management challenges include handling real-time bookings, preventing scheduling conflicts, and ensuring secure payment processing. For example, a course may have multiple sessions, and an event like a music festival needs venue and ticket tracking. Poor data organization can lead to double bookings or payment disputes. An ER Diagram addresses these by clearly defining relationships, such as Users enrolling in Courses or Participants attending Events.
Consider a real-world example: a platform like SkillShare or Eventbrite hosting a yoga retreat. The system tracks Users (instructors and learners), Courses (yoga sessions), Bookings, Payments, and Events (retreat activities), plus Venues and Tickets. An ER Diagram ensures efficient data flow, enabling seamless registration, scheduling, and feedback collection. By resolving these challenges, ER Diagrams support scalable, user-friendly marketplaces for skill-sharing and event management.
Key Concepts of ER Diagrams
An Entity Relationship (ER) Diagram is a visual tool for database design, featuring entities, attributes, relationships, and keys. Entities represent objects (e.g., User, Course), attributes describe properties (e.g., User: ID, Name), and relationships show connections (e.g., User ENROLLS_IN Course). Primary keys uniquely identify records (e.g., UserID), while foreign keys link entities (e.g., CourseID in Booking).
In an Online Skill-sharing Marketplace, entities include User, Course, Event, and Payment. For example, a Course has attributes like CourseID, Title, and Price, while an Event (e.g., a dance workshop) includes EventID, Date, and VenueID. Relationships like User MAKES Payment or Participant ATTENDS Event have cardinality (e.g., one User makes many Payments). Sports and cultural events add entities like Ticket, with attributes like TicketID and Price, linked to Events.
Here’s a simple example:
Entity: User
- Attributes: UserID (Primary Key), Name, Email
Relationship: User ENROLLS_IN Course (one-to-many)
This ensures Users are linked to their enrolled Courses, avoiding duplication. ER Diagrams clarify these connections, enabling beginners to model data for skill-sharing platforms and events efficiently. Visualizing a User entity with attributes and its relationship to Course lays the foundation for complex marketplace databases.
Designing the ER Diagram for Online Skill sharing Marketplace
Creating an ER Diagram for an Online Skill-sharing Marketplace, including sports and cultural events, involves four steps: identifying entities, defining attributes, establishing relationships, and specifying constraints.
Step 1: Identify Entities
Key entities include:
- User: Instructors or learners.
- Course: Skill-sharing offerings (e.g., coding, yoga).
- Booking: Course enrollments.
- Payment: Financial transactions.
- Event: Sports or cultural activities (e.g., marathon, art workshop).
- Participant: Event attendees.
- Venue: Event locations.
- Ticket: Event entry passes.
- Review: User feedback on courses or events.
- Category: Course or event classifications (e.g., sports, arts).
Step 2: Define Attributes
Each entity has attributes:
- User: UserID (PK), Name, Email, Role
- Course: CourseID (PK), Title, Price, UserID (FK)
- Booking: BookingID (PK), UserID (FK), CourseID (FK), Date
- Payment: PaymentID (PK), Amount, UserID (FK), BookingID (FK)
- Event: EventID (PK), Name, Date, VenueID (FK)
- Participant: ParticipantID (PK), Name, Contact
- Venue: VenueID (PK), Name, Location, Capacity
- Ticket: TicketID (PK), EventID (FK), ParticipantID (FK), Price
- Review: ReviewID (PK), Rating, Comment, UserID (FK), CourseID (FK), EventID (FK)
- Category: CategoryID (PK), Name
Step 3: Establish Relationships
Relationships include:
- User TEACHES Course: One User (instructor) teaches many Courses.
- User MAKES Booking: One User makes many Bookings.
- Booking INCLUDES Course: One Booking is for one Course.
- User MAKES Payment: One User makes many Payments.
- Payment COVERS Booking: One Payment covers one Booking.
- Event HELD_AT Venue: One Event occurs at one Venue.
- Participant ATTENDS Event: Many Participants attend one Event.
- Ticket ISSUED_FOR Event: One Ticket is for one Event and one Participant.
- User SUBMITS Review: One User submits many Reviews for Courses or Events.
- Course BELONGS_TO Category: Many Courses belong to one Category.
Step 4: Specify Constraints
- Primary Keys: Unique identifiers (e.g., UserID, CourseID).
- Foreign Keys: Link entities (e.g., UserID in Booking).
- Cardinality: One-to-many (e.g., User to Booking), many-to-many (none here, resolved via Booking and Ticket).
Textual Description: The ER Diagram includes 10 entities connected via relationships. Users teach Courses, make Bookings, and submit Reviews. Payments cover Bookings, while Events, Participants, Venues, and Tickets manage sports and cultural activities. Categories classify Courses and Events.
ER Diagram Example
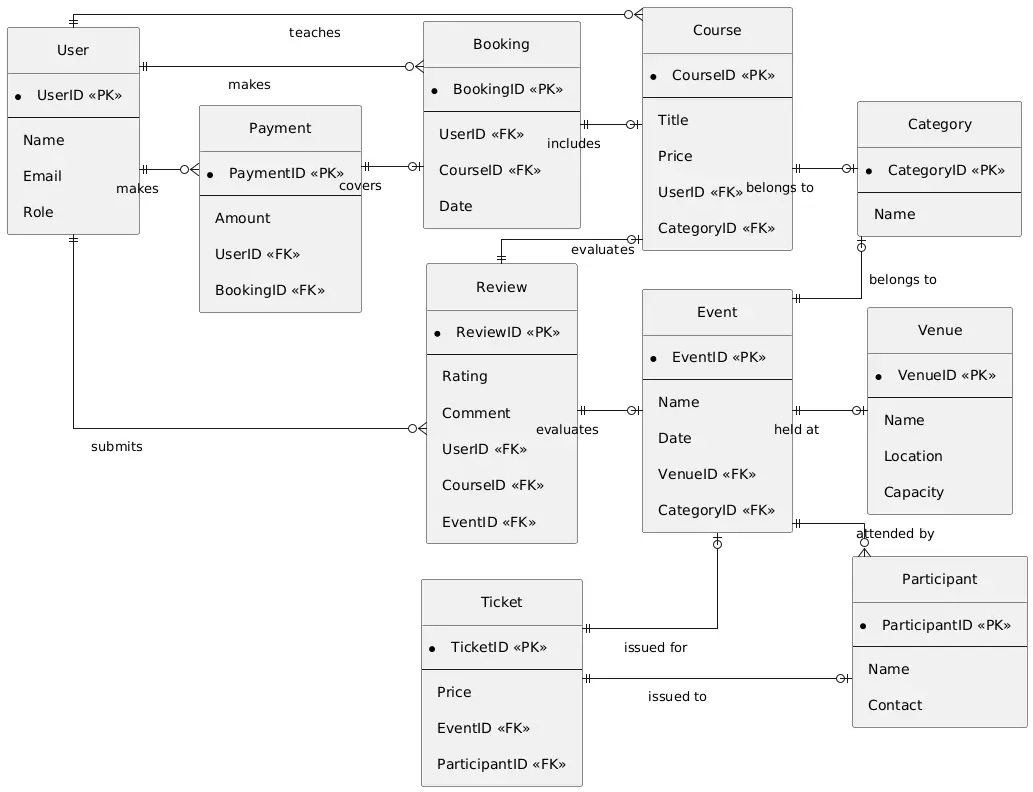
The ER Diagram for the Online Skill-sharing Marketplace, including sports and cultural events, is conceptualized using PlantUML (script below). It features 10 entities: User, Course, Booking, Payment, Event, Participant, Venue, Ticket, Review, and Category.
Diagram Walkthrough:
- User (UserID, Name, Email, Role) teaches Courses and makes Bookings and Payments.
- Course (CourseID, Title, Price, UserID) belongs to a Category and is included in Bookings.
- Booking (BookingID, UserID, CourseID, Date) links Users to Courses.
- Payment (PaymentID, Amount, UserID, BookingID) covers Bookings.
- Event (EventID, Name, Date, VenueID) is held at a Venue and attended by Participants.
- Participant (ParticipantID, Name, Contact) attends Events and holds Tickets.
- Venue (VenueID, Name, Location, Capacity) hosts Events.
- Ticket (TicketID, EventID, ParticipantID, Price) links Participants to Events.
- Review (ReviewID, Rating, Comment, UserID, CourseID, EventID) captures feedback for Courses or Events.
- Category (CategoryID, Name) classifies Courses and Events.
Domain-Specific Nuances: The diagram tracks Course prices and Payment amounts for financial transparency, Ticket prices for event revenue, and Review ratings for quality assurance. The Category entity ensures easy browsing of skills and events, critical for user engagement.
This ER Diagram provides a scalable structure for managing skill-sharing and event data, ensuring efficient operations and user satisfaction.
PlantUML Script for Online Skill-sharing Marketplace ERD
@startuml
' Set horizontal layout
left to right direction
' Hide the spot
hide circle
' Use orthogonal lines to avoid intersections
skinparam linetype ortho
' Adjust padding for clarity
skinparam monochrome true
skinparam padding 10

entity "User" {
* UserID <<PK>>
--
Name
Email
Role
}

entity "Course" {
* CourseID <<PK>>
--
Title
Price
UserID <<FK>>
CategoryID <<FK>>
}

entity "Booking" {
* BookingID <<PK>>
--
UserID <<FK>>
CourseID <<FK>>
Date
}

entity "Payment" {
* PaymentID <<PK>>
--
Amount
UserID <<FK>>
BookingID <<FK>>
}

entity "Event" {
* EventID <<PK>>
--
Name
Date
VenueID <<FK>>
CategoryID <<FK>>
}

entity "Participant" {
* ParticipantID <<PK>>
--
Name
Contact
}

entity "Venue" {
* VenueID <<PK>>
--
Name
Location
Capacity
}

entity "Ticket" {
* TicketID <<PK>>
--
Price
EventID <<FK>>
ParticipantID <<FK>>
}

entity "Review" {
* ReviewID <<PK>>
--
Rating
Comment
UserID <<FK>>
CourseID <<FK>>
EventID <<FK>>
}

entity "Category" {
* CategoryID <<PK>>
--
Name
}

' Relationships with clear labels and correct cardinality
User ||--o{ Course : "teaches"
User ||--o{ Booking : "makes"
Booking ||--o| Course : "includes"
User ||--o{ Payment : "makes"
Payment ||--o| Booking : "covers"
Event ||--o| Venue : "held at"
Event ||--o{ Participant : "attended by"
Ticket ||--o| Event : "issued for"
Ticket ||--o| Participant : "issued to"
User ||--o{ Review : "submits"
Review ||--o| Course : "evaluates"
Review ||--o| Event : "evaluates"
Course ||--o| Category : "belongs to"
Event ||--o| Category : "belongs to"

@enduml
Notes:
- Orthogonal lines (skinparam linetype ortho) and padding (skinparam padding 10) minimize line intersections.
- All 10 entities are connected with clear relationship labels (e.g., “teaches”, “issued for”).
- Primary keys (<<PK>>) and foreign keys (<<FK>>) are marked.
- No many-to-many relationships require a junction table, as Booking and Ticket resolve them.
- The diagram is comprehensive, covering skill-sharing and event management.
Best Practices for Online Skill-sharing Marketplace ER Diagrams
Designing effective ER Diagrams for an Online Skill-sharing Marketplace requires precision to ensure scalability and usability. Here are key best practices:
- Normalize Data: Avoid redundancy by separating entities like User and Booking. This prevents duplicate user data and streamlines queries for course enrollments.
- Use Intuitive Naming: Name entities and attributes clearly (e.g., CourseID, PaymentAmount) to improve readability for developers and platform managers.
- Define Relationships Clearly: Specify cardinality accurately, such as one User making many Bookings, to prevent scheduling conflicts.
- Ensure Scalability: Design for growth, accommodating diverse Courses (e.g., coding, sports) and Events (e.g., festivals). Include flexible attributes like CategoryID.
- Validate with Stakeholders: Collaborate with platform owners and event organizers to ensure entities like Ticket and Venue meet operational needs.
Common Pitfalls to Avoid:
- Overcomplicating Relationships: Avoid redundant links, like directly connecting User to Venue, which can clutter the diagram.
- Ignoring Constraints: Define primary and foreign keys to maintain data integrity, especially for Payments and Tickets.
- Neglecting Reviews: Include Review entities to capture feedback, vital for user trust and platform improvement.
Recommended Tools: Use MySQL Workbench for database integration, Lucidchart for collaborative design, or Draw.io for free diagramming. These tools simplify ER Diagram creation and refinement. By adhering to these practices, your ER Diagram will support efficient, user-friendly skill-sharing and event management systems.
Real-World Applications
An ER Diagram for an Online Skill-sharing Marketplace translates into a robust database powering platforms like Udemy, SkillShare, or Eventbrite. For skill-sharing, the diagram supports course management, user enrollment, and payment processing. For example, a platform offering photography courses can use the database to track Users (instructors and learners), Courses, Bookings, and Payments, ensuring seamless scheduling and secure transactions. The Review entity enables feedback collection, enhancing course quality and user trust.
For sports and cultural events, the diagram underpins ticketing and event management systems. Entities like Event, Participant, Venue, and Ticket enable platforms to manage marathons or music festivals, handling registrations, venue assignments, and ticket sales. For instance, a city hosting a dance festival can use the database to assign Venues, issue Tickets, and track Participants, integrating with mobile apps for real-time updates.
Industries relying on such diagrams include e-learning, event planning, and fintech (for payment processing). Tools like PostgreSQL or MongoDB implement these schemas for Civil liberties, while platforms like Coursera or Ticketmaster customize them for user and event management. A case study example is MasterClass, which uses similar database structures to manage celebrity-led courses, bookings, and payments, ensuring a smooth user experience.
The ER Diagram’s flexibility supports analytics, such as tracking popular Courses or Event attendance, and integrates with APIs for payment gateways like Stripe. By clearly mapping relationships, the diagram ensures data integrity and scalability, empowering platforms to handle growing user bases and diverse offerings effectively.
Conclusion
This guide has detailed designing an ER Diagram for an Online Skill-sharing Marketplace, including sports and cultural events. By identifying entities like User, Course, Event, and Ticket, defining attributes, and establishing relationships, the ER Diagram simplifies data modeling for skill-sharing and event management. It tackles challenges like real-time bookings and secure payments, ensuring efficient operations. The PlantUML script and best practices provide a practical framework for building scalable databases.
Key takeaways include the need for clear relationships, normalized data, and stakeholder collaboration to meet platform needs. Whether you’re a database designer, developer, or student, this ER Diagram equips you to create systems that enhance user experiences. Try designing your own diagram using tools like Lucidchart or MySQL Workbench, or explore related domains like e-commerce.
We’d love your feedback! Share your thoughts below, read our next post on database optimization, or visit x.ai for more resources. Start modeling your skill-sharing marketplace database today and power the future of learning and events!
You may visit our Facebook page for more information, inquiries, and comments. Please subscribe also to our YouTube Channel to receive free capstone projects resources and computer programming tutorials.
Hire our team to do the project.