Driver Conduct Reporting Entity Relationship Diagram
Introduction
Table of Contents
Driver conduct reporting is a vital component in maintaining public safety and ensuring accountability, especially in domains involving transportation services during sports and cultural events. Whether it’s organizing shuttle services for festivals or ensuring compliance among school bus drivers, collecting and analyzing driver behavior data helps institutions manage risks and improve service quality. With increasing concerns around road safety and event logistics, a well-structured database system becomes essential.
An Entity Relationship Diagram (ER Diagram or ERD) is a visual tool used in database design to map out the structure of data. It outlines entities (like Driver, Vehicle, or Event), their attributes (such as Name, License Number, or Date), and the relationships between them. This diagram simplifies complex data into a clear, logical model, making it easier to implement efficient and reliable database systems.
This blog post aims to guide you through understanding and creating an ER Diagram specifically for a Driver Conduct Reporting System that includes scenarios from sports and cultural events. It will help you identify key entities, define relationships, and construct a robust model that supports real-world data processing needs.
This guide targets database designers, system developers, IT students, and project managers who are planning to build or maintain systems that track driver behavior in the context of events and transportation services. If you’re working on a capstone project or a commercial application related to logistics, events, or compliance monitoring, this post will provide a strong foundation to design your database effectively.
Overview of the Domain
The Driver Conduct Reporting domain focuses on recording and managing data related to driver behavior, infractions, assignments, and feedback, especially in environments involving organized events such as sports matches, parades, concerts, and festivals. These scenarios often involve temporary or contracted drivers responsible for safely transporting people or equipment.
Key components in this domain include:
- Drivers: Individuals operating transport vehicles.
- Vehicles: Buses, vans, or trucks assigned for transportation.
- Events: Sports or cultural activities requiring transport services.
- Reports: Observations and feedback related to driver behavior.
- Incidents: Documented violations or accidents.
- Supervisors: Individuals overseeing operations and submitting reports.
The processes include assigning drivers to events, recording their conduct, collecting evaluations from supervisors or passengers, and tracking recurring issues. Often, drivers are assigned to multiple events, and incidents can involve more than one stakeholder, making the data complex and interrelated.
Data management challenges include:
- Ensuring accuracy of incident reporting.
- Linking multiple records (driver to event, report to incident, etc.).
- Preventing data duplication and inconsistencies.
- Tracking driver performance over time.
For example, consider a city hosting a week-long sports festival. Drivers are assigned daily routes. After each day, supervisors submit conduct reports. Some drivers receive commendations, while others are reported for tardiness or unsafe driving. Capturing all this data in an organized database requires an ER Diagram to model the relationships clearly.
An ERD not only structures this data but also ensures that the system is scalable and ready to integrate with analytics tools or mobile reporting apps. This structured approach supports better decision-making and enhances overall event transportation management.
Key Concepts of ER Diagrams
Before designing a domain-specific ER Diagram, let’s review the fundamental concepts:
- Entities: These are real-world objects or concepts with distinct existence, such as Driver, Vehicle, or Event.
- Attributes: These define properties of entities, like Driver Name, License Number, or Event Date.
- Relationships: These describe how entities interact. For instance, a Driver “is assigned to” an Event.
- Primary Key (PK): A unique identifier for each entity record (e.g., DriverID).
- Foreign Key (FK): An attribute in one entity that links it to a primary key in another entity (e.g., EventID in the DriverAssignment table).
In the Driver Conduct Reporting domain:
- A Driver operates one or more Vehicles.
- A Driver can be assigned to multiple Events.
- Conduct Reports relate to specific drivers and events.
- Incidents record violations tied to a specific report.
Let’s look at a simplified example:
Entities:
- Driver: DriverID (PK), Name, LicenseNo
- Event: EventID (PK), Name, Date
- Report: ReportID (PK), DriverID (FK), EventID (FK), Feedback
Relationship:
- Driver submits a Report for an Event.
This simple model shows how even basic relationships can form the foundation of a scalable system. Understanding these basics will help you map complex scenarios with confidence.
Designing the ER Diagram for Driver Conduct Reporting
Step 1: Identify Entities
Here are the main entities in this domain:
- Driver
- Vehicle
- Event
- Supervisor
- ConductReport
- Incident
- Route
- Assignment
- PassengerFeedback
- ViolationType
Step 2: Define Attributes
- Driver: DriverID (PK), Name, LicenseNo, ContactNumber
- Vehicle: VehicleID (PK), PlateNumber, Type, Capacity
- Event: EventID (PK), Name, Date, Location, Type (Sport or Cultural)
- Supervisor: SupervisorID (PK), Name, ContactInfo
- ConductReport: ReportID (PK), DriverID (FK), EventID (FK), SupervisorID (FK), ReportDate, Remarks
- Incident: IncidentID (PK), ReportID (FK), ViolationTypeID (FK), Description, Date
- Route: RouteID (PK), Name, Distance, Duration
- Assignment: AssignmentID (PK), DriverID (FK), VehicleID (FK), RouteID (FK), EventID (FK), AssignmentDate
- PassengerFeedback: FeedbackID (PK), DriverID (FK), EventID (FK), Rating, Comments
- ViolationType: ViolationTypeID (PK), Name, Penalty
Step 3: Establish Relationships
- A Driver can have multiple Assignments.
- A Driver can receive multiple ConductReports.
- Each Report can link to multiple Incidents.
- An Incident references a ViolationType.
- A Driver can get feedback via PassengerFeedback.
- A Supervisor submits a ConductReport.
- A Driver is assigned to Vehicle via Assignment.
- A Route belongs to an Event.
Step 4: Specify Constraints
- Use DriverID as the PK in the Driver table.
- Foreign keys: DriverID, EventID, ReportID, etc., ensure referential integrity.
- One-to-many: One driver can have many assignments or reports.
- Many-to-many: Drivers and events via Assignment (junction table).
- Cardinality: One event can have many drivers assigned.
This ERD structure supports robust tracking of driver conduct, vehicles, events, and reporting history.
ER Diagram Example
Imagine a Driver Conduct Reporting System used during a national sports event. Over 50 drivers are assigned to routes transporting athletes and equipment. Supervisors monitor behavior and submit reports each day.
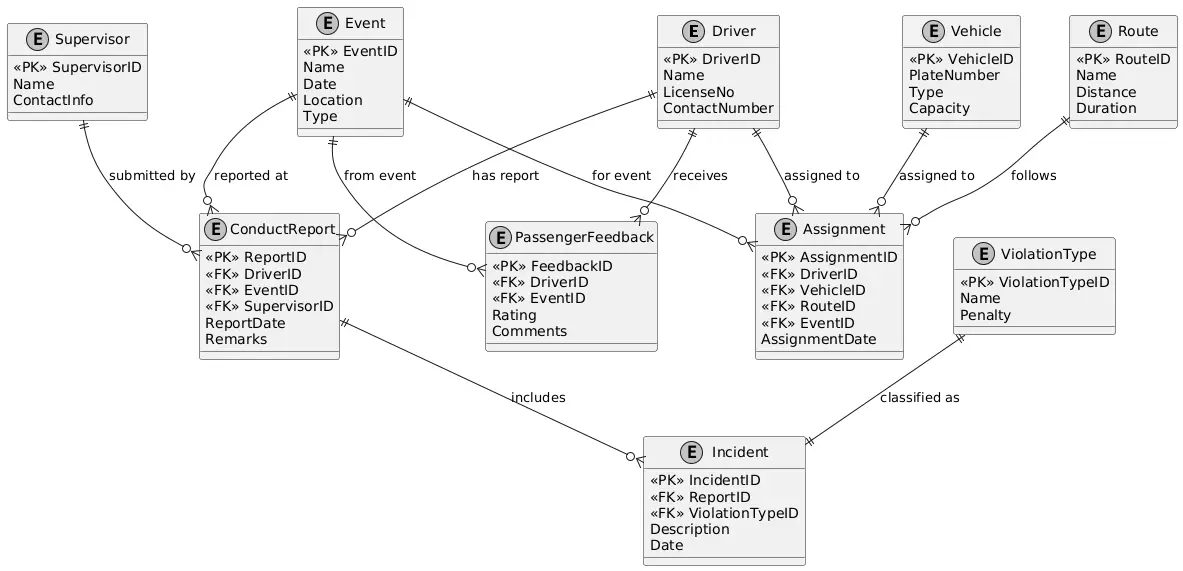
The ER Diagram includes:
- Driver (DriverID, Name, LicenseNo)
- Vehicle (VehicleID, PlateNumber)
- Event (EventID, Name, Date)
- Supervisor (SupervisorID, Name)
- ConductReport (ReportID, DriverID, EventID, SupervisorID, Remarks)
- Incident (IncidentID, ReportID, ViolationTypeID, Description)
- ViolationType (ViolationTypeID, Name, Penalty)
- Route (RouteID, Name, Distance)
- Assignment (AssignmentID, DriverID, VehicleID, RouteID, EventID)
- PassengerFeedback (FeedbackID, DriverID, EventID, Rating, Comments)
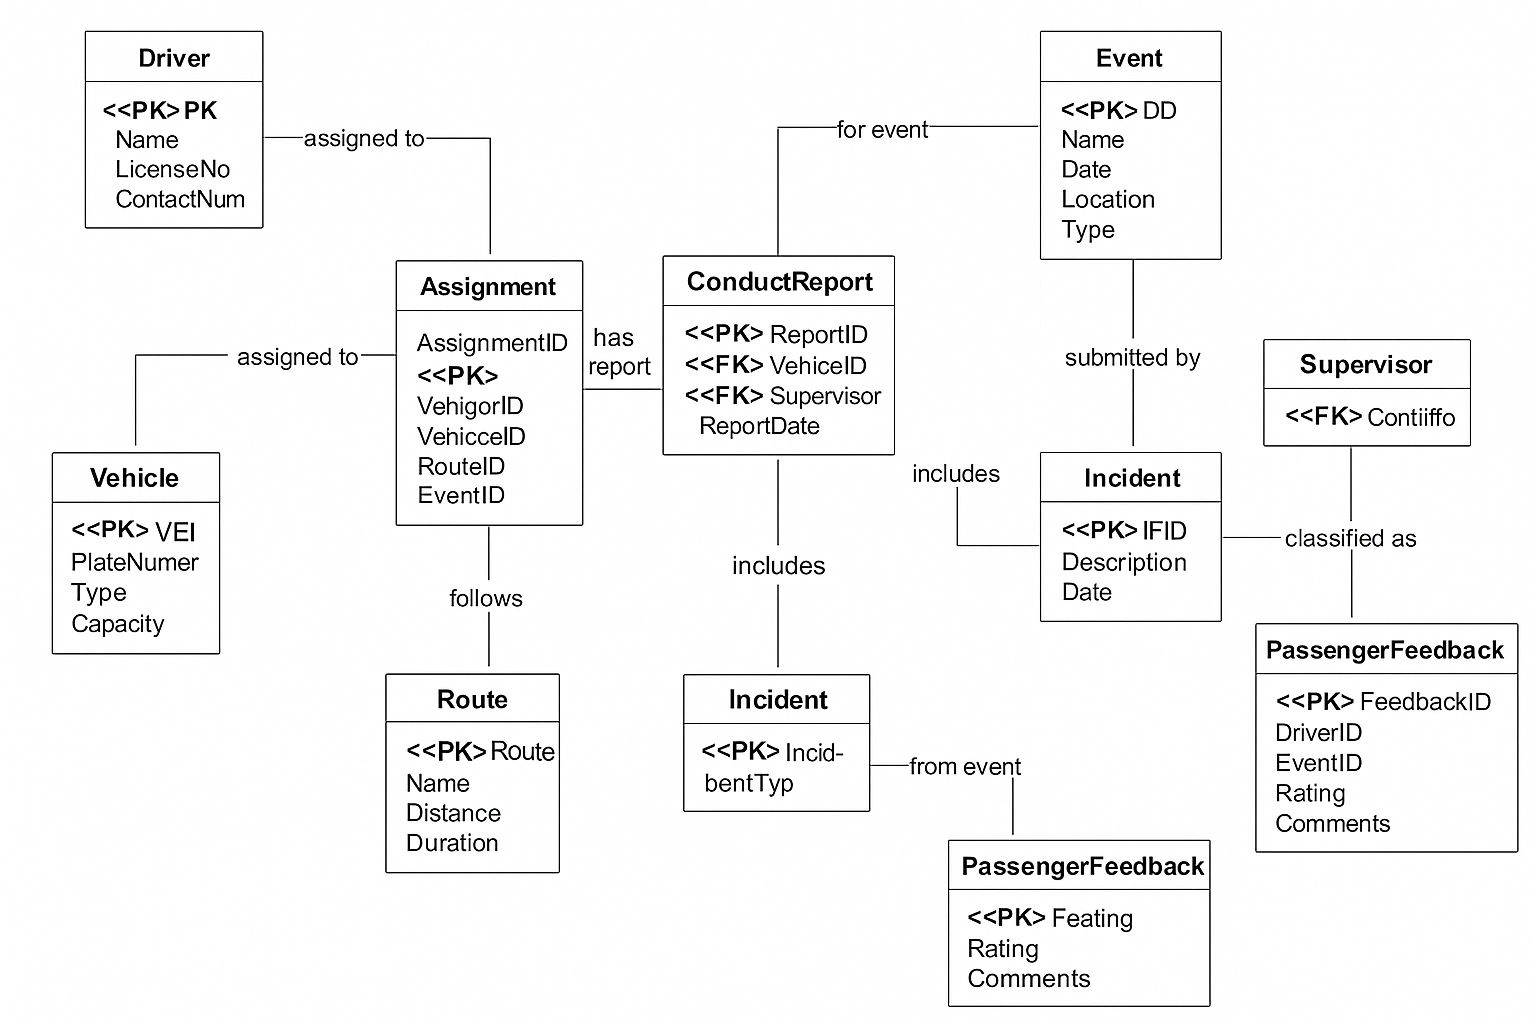
Diagram Structure:
- The Assignment table connects Drivers, Vehicles, Routes, and Events.
- The ConductReport is created by a Supervisor and tied to a Driver and Event.
- Each ConductReport may link to multiple Incidents, categorized by ViolationType.
- The PassengerFeedback table logs user evaluations for specific events.
This layout avoids redundancy and keeps data relational. It’s ideal for audits, performance reviews, or logistics optimization.
PlantUML Script
@startuml
' Avoid line intersections with layout adjustments
skinparam monochrome true
skinparam ranksep 60
skinparam nodesep 50

entity Driver {
<<PK>> DriverID
Name
LicenseNo
ContactNumber
}

entity Vehicle {
<<PK>> VehicleID
PlateNumber
Type
Capacity
}

entity Event {
<<PK>> EventID
Name
Date
Location
Type
}

entity Supervisor {
<<PK>> SupervisorID
Name
ContactInfo
}

entity ConductReport {
<<PK>> ReportID
<<FK>> DriverID
<<FK>> EventID
<<FK>> SupervisorID
ReportDate
Remarks
}

entity Incident {
<<PK>> IncidentID
<<FK>> ReportID
<<FK>> ViolationTypeID
Description
Date
}

entity ViolationType {
<<PK>> ViolationTypeID
Name
Penalty
}

entity Route {
<<PK>> RouteID
Name
Distance
Duration
}

entity Assignment {
<<PK>> AssignmentID
<<FK>> DriverID
<<FK>> VehicleID
<<FK>> RouteID
<<FK>> EventID
AssignmentDate
}

entity PassengerFeedback {
<<PK>> FeedbackID
<<FK>> DriverID
<<FK>> EventID
Rating
Comments
}

Driver ||--o{ Assignment : "assigned to"
Vehicle ||--o{ Assignment : "assigned to"
Route ||--o{ Assignment : "follows"
Event ||--o{ Assignment : "for event"
Driver ||--o{ ConductReport : "has report"
Event ||--o{ ConductReport : "reported at"
Supervisor ||--o{ ConductReport : "submitted by"
ConductReport ||--o{ Incident : "includes"
ViolationType ||--|| Incident : "classified as"
Driver ||--o{ PassengerFeedback : "receives"
Event ||--o{ PassengerFeedback : "from event"

@enduml
Best Practices for Driver Conduct Reporting ER Diagrams
Designing ER Diagrams for a Driver Conduct Reporting System requires clarity and normalization:
Tips:
- Normalize tables to eliminate redundancy (e.g., separate ViolationType from Incident).
- Use descriptive names for entities and relationships.
- Include a junction table for many-to-many relationships (e.g., Assignment).
- Plan for scalability by using surrogate keys like DriverID instead of names.
- Validate foreign key integrity to avoid orphan records.
Common Pitfalls to Avoid:
- Avoid placing too many attributes in one table (e.g., don’t merge Event and Assignment).
- Don’t skip constraint definitions; missing PK/FK links can break relationships.
- Resist overcomplicating with rarely used attributes—keep the model clean.
Recommended Tools:
- Draw.io – Great for visualizing complex relationships.
- Lucidchart – User-friendly interface with team collaboration.
- MySQL Workbench – Ideal if you plan to implement the schema directly.
- ERDPlus – Simple and academic-focused for student projects.
A well-structured ER Diagram lays the groundwork for solid implementation, clear documentation, and smooth data integration later.
Real-World Applications
Driver conduct reporting is essential in industries where safe transportation is non-negotiable. A structured ER Diagram becomes the foundation for systems that manage personnel, monitor performance, and generate compliance reports.
Transportation Services:
City transport agencies use these systems to assign drivers to buses and routes during large events. The ERD supports real-time updates on driver status, incidents, and supervisor feedback.
Event Management:
Organizers of sports tournaments and cultural festivals rely on transportation logistics. The ERD connects drivers to events, ensuring the right people are on the right routes and reports are filed daily.
Fleet Management Platforms:
Commercial systems like Samsara or Verizon Connect can use ERDs to log incidents and performance data, with integration for IoT sensors and GPS.
School and University Transport:
Schools can track driver conduct during field trips or regular transport, connecting reports to student feedback and administrative actions.
Case Study:
A provincial sports committee deployed a mobile app to report driver behavior during inter-collegiate games. Supervisors used QR codes to link reports to drivers and events. The backend relied on an ER Diagram like the one discussed, linking assignments, incidents, and feedback seamlessly.
A good ERD ensures system extensibility—new features like mobile reporting, biometric driver verification, or AI-based behavior analysis can be layered on top of it.
Conclusion
Creating an ER Diagram for a Driver Conduct Reporting System is a critical first step in building a reliable, scalable database. This domain involves various interconnected components—drivers, vehicles, events, feedback, and violations—which must be logically structured for effective data analysis and system functionality.
Using ER Diagrams helps developers, students, and organizations visualize data relationships, avoid redundancy, and implement efficient systems. Whether you’re managing sports event logistics or tracking city transport conduct, this model can serve as your blueprint.
Try building your own ER Diagram based on the examples provided. Test different scenarios like multiple drivers for one route or repeated incidents under one event. This will deepen your understanding and prepare you for real-world database design challenges.
Explore our next post to learn how to implement this ERD in a relational database. Share your feedback and let us know what other domains you’d like us to cover next!
You may visit our Facebook page for more information, inquiries, and comments. Please subscribe also to our YouTube Channel to receive free capstone projects resources and computer programming tutorials.
Hire our team to do the project.