Building an Online Platform for Marine Pollution Detection Using Remote Sensing: Lessons from the Trenches
Table of Contents
- Building an Online Platform for Marine Pollution Detection Using Remote Sensing: Lessons from the Trenches
- What Remote Sensing Brings to the Table for Marine Pollution
- Bringing AI into the Mix
- Why Build an Online Platform? (And Not Just a Script)
- The Tech Stack: What We Actually Built With
- Core Features That Make It Useful
- Challenges We Hit (And How We Pushed Through)
- Real Impact and What’s Next
- Wrapping Up: Tech That Actually Matters
Hey there, fellow techies and ocean lovers. If you’ve ever stared at a beach covered in plastic or read about massive oil spills wiping out marine life, you know how urgent this problem is. Oceans cover over 70% of our planet, but they’re taking a beating—millions of tons of plastic enter the water every year, oil spills happen more often than we’d like, and algal blooms from nutrient pollution create dead zones. Traditional ship-based surveys and beach cleanups are essential but painfully slow and limited in scope. That’s where remote sensing comes in, and as someone who’s spent the last couple of years leading the development of an online platform to make this tech accessible, I want to walk you through the whole journey.
Our platform isn’t just another dashboard—it’s a full-fledged web application that ingests satellite data, runs AI models to spot pollution in near real-time, and serves interactive maps and alerts to researchers, NGOs, governments, and even concerned citizens. It’s IT at the intersection of environmental science, and building it taught me more about scalability, geospatial data, and the sheer messiness of real-world ocean monitoring than any textbook ever could.
What Remote Sensing Brings to the Table for Marine Pollution
Remote sensing basically means gathering information about the ocean from a distance, mostly via satellites. No boats required for the initial sweep. For marine pollution, two big players stand out: optical sensors and radar.
Sentinel-2 (from Europe’s Copernicus program) gives us multispectral imagery—think multiple bands of light, including near-infrared. Plastics and other debris have unique reflectance signatures; they often stand out against water in certain wavelengths. Recent work, like the MADOS dataset and MariNeXt model, shows you can train deep learning networks to pick out not just plastics but oil spills, foam, and other sea surface features across global scenes.
Sentinel-1 uses Synthetic Aperture Radar (SAR), which is gold for oil spills because it works day or night and through clouds. Oil dampens waves, changing how radar bounces back, creating dark patches in the imagery. It’s been used successfully for early warning systems in places like the Mediterranean.
Other sensors help too—Landsat for historical trends, hyperspectral ones (emerging) for finer material identification, and even experimental microwave approaches that detect surface roughness from plastics. But raw satellite data is just pixels. Turning it into something usable? That’s where the IT heavy lifting starts.
I remember our first prototype: we pulled a bunch of Sentinel-2 scenes over a known polluted area. Without preprocessing (atmospheric correction, cloud masking), the model was basically guessing. Lesson one: data hygiene is everything.
Bringing AI into the Mix
Once you have clean imagery, machine learning takes over. Simple thresholding worked for obvious oil slicks in the old days, but today’s platforms need to handle complexity—look-alikes like biogenic films, varying water conditions, and tiny plastic patches.
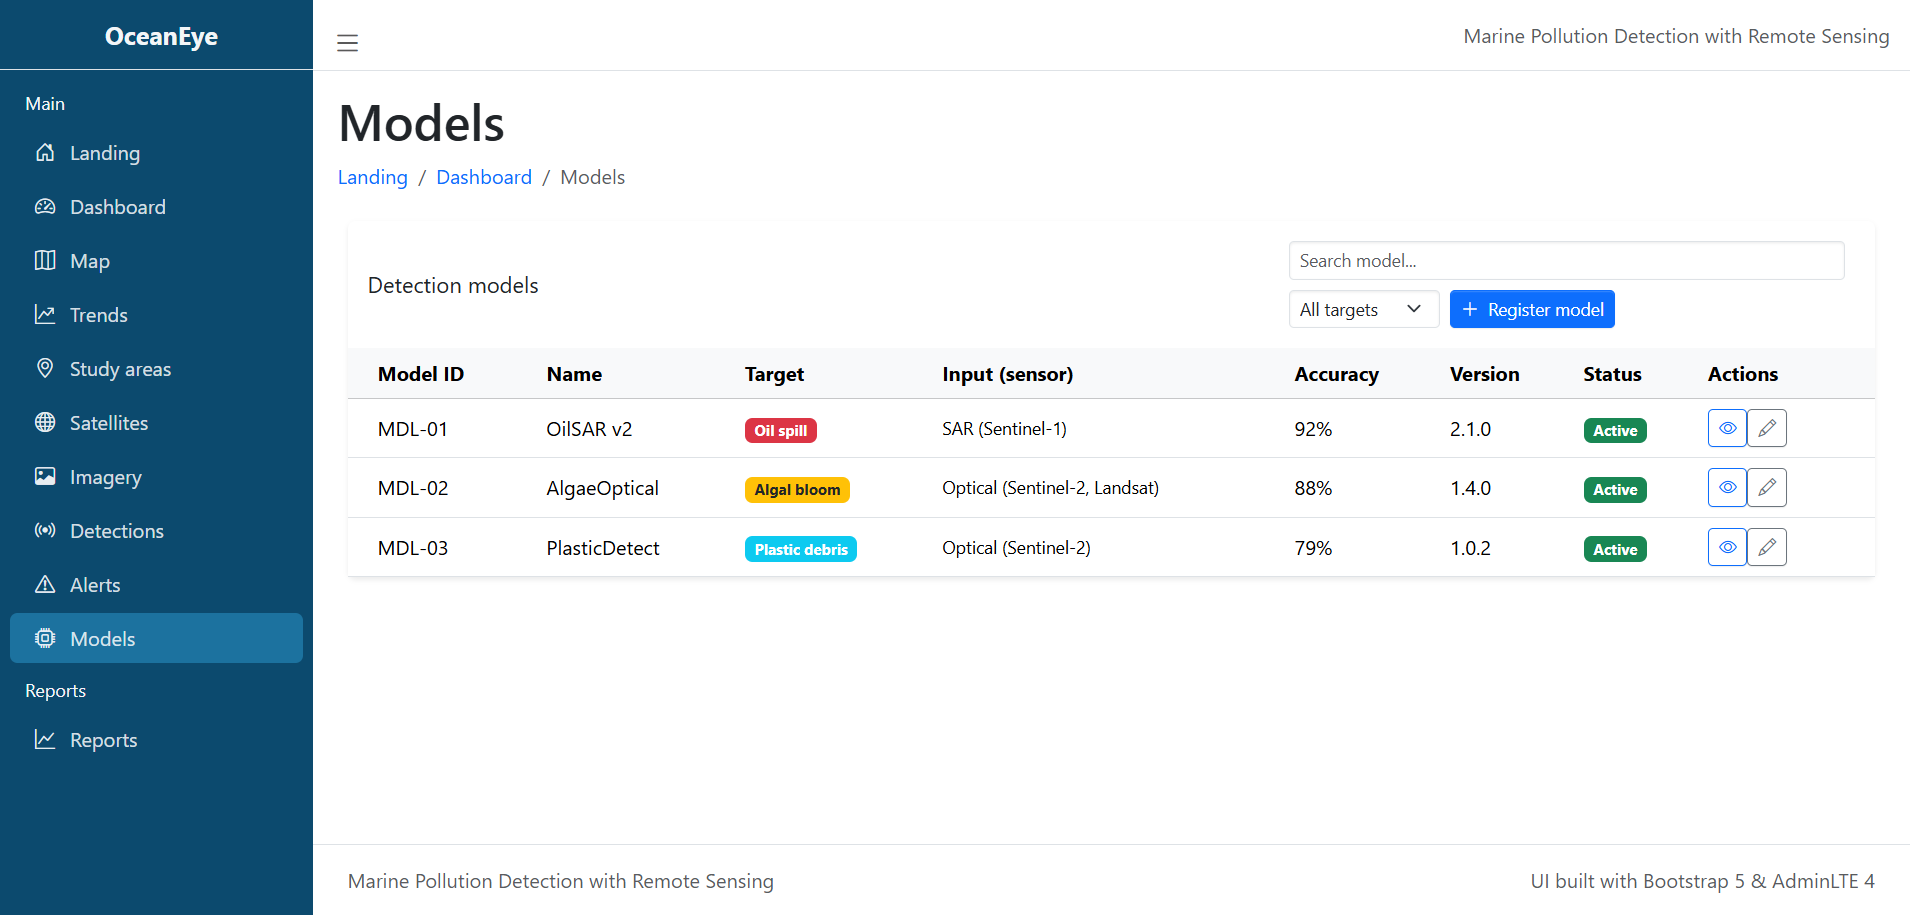
We leaned heavily into semantic segmentation models. Think U-Net variants or more advanced architectures like the ones behind MariNeXt, which outperforms baselines by a solid margin on multi-class problems (plastics, oil, natural features, etc.). Training on datasets like MADOS (174 Sentinel-2 scenes with millions of annotated pixels) was key for generalization.
On the backend, we run inference using PyTorch or TensorFlow, often on GPU instances in the cloud. But here’s the reality check: satellite data is huge. A single Sentinel scene can be gigabytes. Processing pipelines involve Google Earth Engine for quick prototyping and heavy lifting, or our own ETL jobs on AWS Batch/Lambda for custom models.
One pain point? Model drift. Ocean conditions change seasonally, and a model trained on Mediterranean data might struggle in the Pacific. We added domain adaptation techniques and periodic retraining with new labeled data from partners. It’s never “set it and forget it.”
Why Build an Online Platform? (And Not Just a Script)
You could run all this in Jupyter notebooks, sure. But the goal was accessibility and action. Policymakers don’t want to learn Python. NGOs in developing regions need mobile-friendly tools. Scientists want collaboration.
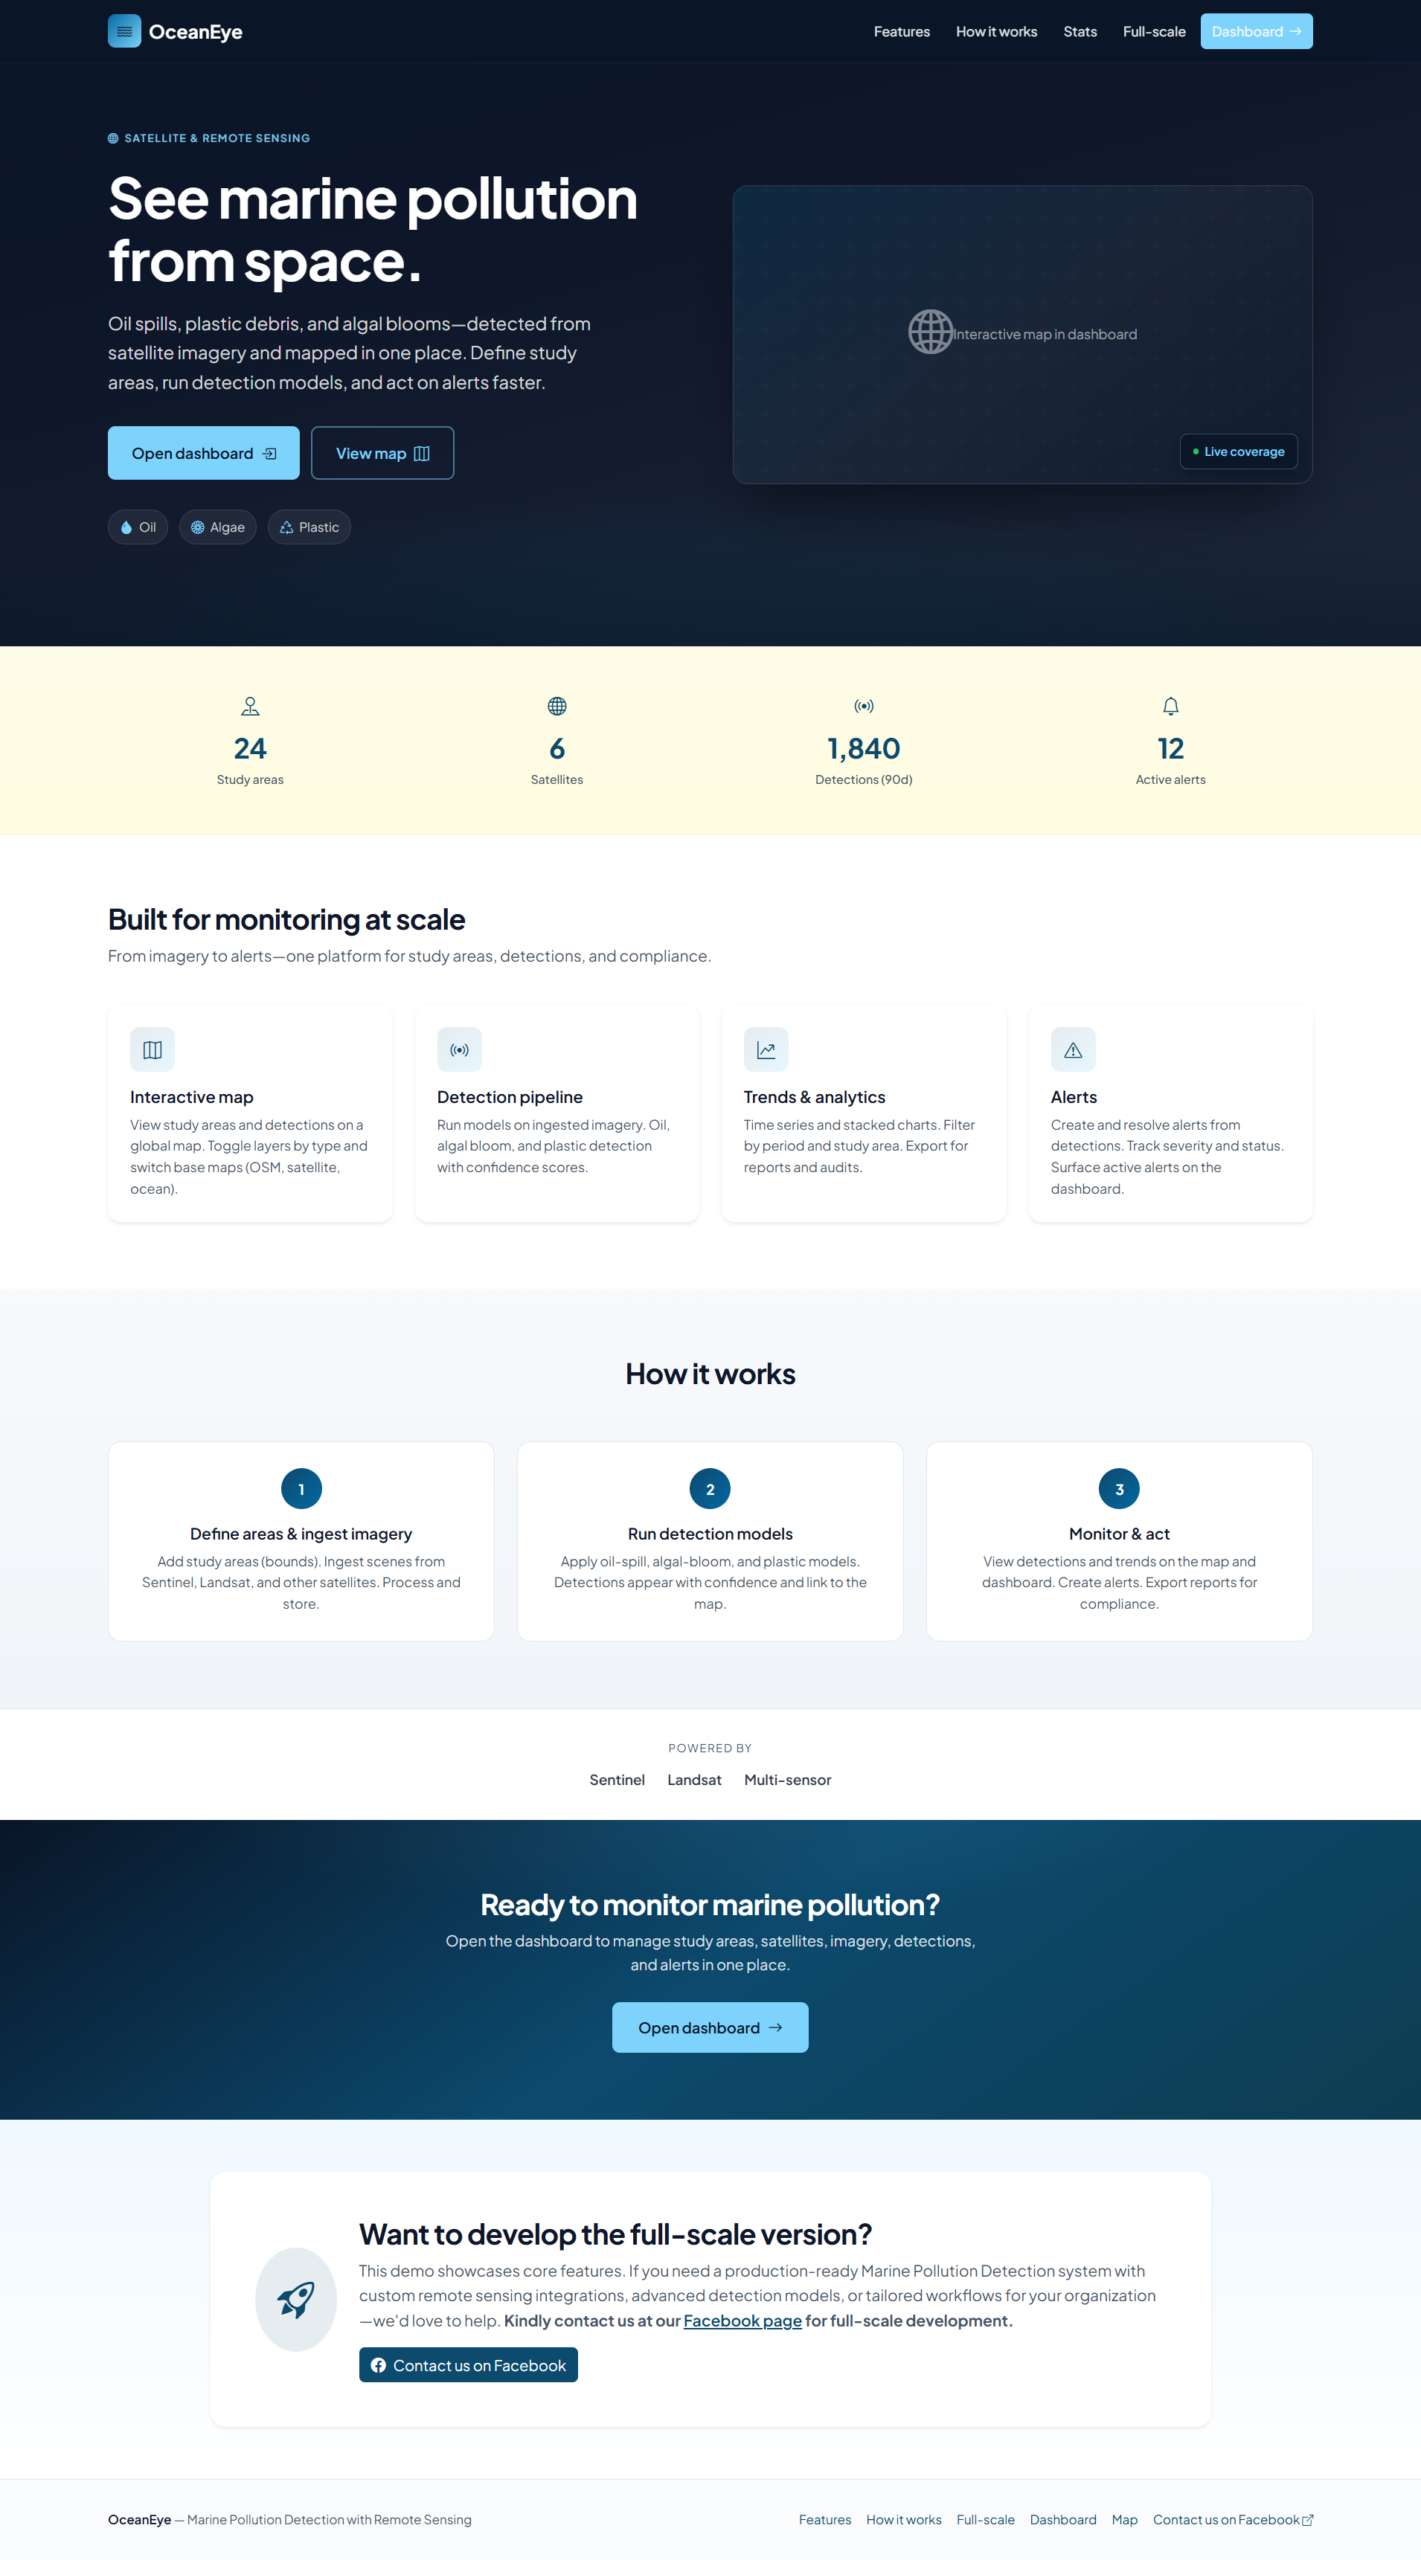
An online platform solves that. Users log in, see a live map of monitored areas, click hotspots for details (confidence scores, time series, spectral signatures), set up alerts (“notify me if oil detected in my coastal zone”), and even upload ground-truth data to improve the models.
It also scales. One organization monitoring one bay is nice; a shared platform covering global hotspots is powerful for spotting trends and coordinating responses.
The Tech Stack: What We Actually Built With
We wanted something modern, scalable, and geospatial-native. Here’s the breakdown:
- Frontend: Next.js (React) for the UI, with Leaflet.js or MapLibre GL for interactive maps. We added deck.gl for 3D overlays and time sliders—watching pollution evolve over weeks is eye-opening. Tailwind for styling kept things fast and clean. The dashboard feels responsive even on tablets, crucial for field teams.
- Backend: FastAPI (Python) because it plays nice with ML libraries and is async-friendly for handling large data requests. We use GeoDjango elements where needed, but FastAPI kept things lightweight.
- Database: PostgreSQL with PostGIS extension. This is non-negotiable for geospatial work—storing polygons of detected pollution, raster metadata, user annotations, all queryable with spatial indexes. We partition tables by date and region for performance.
- Data Pipeline:
- Ingestion: Scripts pull from Copernicus Open Access Hub or use AWS public datasets for Sentinel.
- Processing: Celery workers for background tasks (preprocessing, model inference). Results stored as GeoTIFFs in S3, with metadata in the DB.
- APIs: REST + GraphQL for flexible frontend queries.
- Cloud & DevOps: AWS primarily (EC2 for heavy compute, S3, RDS for Postgres, Lambda for lightweight triggers). Docker + Kubernetes for orchestration. CI/CD with GitHub Actions. We also experimented with Google Cloud Run for some serverless parts.
Security mattered—role-based access (public view vs. admin model training), data encryption, and compliance considerations for environmental reporting.
Core Features That Make It Useful
- Interactive Global Map: Zoomable, with layers for different pollutants, confidence heatmaps, and historical comparisons.
- Real-Time Alerts: WebSocket connections + email/SMS for new detections above thresholds.
- Analytics Dashboard: Charts showing trends, like plastic accumulation in gyres or spill response times.
- Collaboration Tools: Users can annotate detections (“this looks like fishing gear”) to feed back into training data.
- Export & Reports: PDF summaries or GeoJSON downloads for official use.
- API Access: For integrating into other systems, like national monitoring networks.
We also added a simple “citizen science” mode where verified users upload photos that get cross-referenced with satellite passes.
Challenges We Hit (And How We Pushed Through)
Data volume nearly killed us early on. Storing and serving petabytes isn’t cheap. Solution: smart caching, on-demand processing, and prioritizing high-risk areas (coastal zones, shipping lanes).
Accuracy in cloudy regions? Optical sensors struggle. We fused SAR and optical data where possible and used models robust to partial occlusions.
User adoption: Tech is great, but if it’s too complex, people won’t use it. We ran beta tests with marine biologists and iterated based on feedback—simplified the UI massively.
Cost: Satellite data is free-ish, but compute adds up. We optimized models (quantization, efficient architectures) and used spot instances.
Real Impact and What’s Next
Early users have already flagged potential spills that ground teams confirmed. In one pilot, the platform helped track debris after a storm, guiding cleanup efforts faster than traditional methods.
Looking ahead, we’re excited about integrating drone feeds, in-situ buoy sensors, and hyperspectral data from newer missions. Edge AI on satellites could enable even faster detection. Multimodal models (combining imagery with ocean current forecasts) will improve predictions.
There’s also huge potential in blockchain for tamper-proof pollution records or open data marketplaces.
Wrapping Up: Tech That Actually Matters
Developing this platform reminded me why I got into tech in the first place—not just for slick UIs or fast queries, but for solving messy, important problems. Marine pollution won’t disappear overnight, but tools like this can make the fight smarter, faster, and more collaborative.
If you’re a developer, researcher, or policymaker interested in ocean health, I’d love to hear your thoughts. Have you worked with geospatial platforms? What features would you want? Drop a comment or reach out—maybe we can collaborate on the next version.
The oceans are calling. Let’s build better ways to answer.
You may visit our Facebook page for more information, inquiries, and comments. Please subscribe also to our YouTube Channel to receive free capstone projects resources and computer programming tutorials.
Hire our team to do the project.