Soil Health Monitoring System Use Case Diagram
Introduction
Table of Contents
Picture this: you’re tasked with building a system to monitor soil health, but the team’s unsure who uses it or what features matter. Use case diagrams save the day! These simple visuals map out how users interact with IT systems, making system design a breeze. For IT students and developers, they’re a must-have tool to understand project scopes and nail requirements. Whether it’s a Soil Health Monitoring System tracking nutrients or a payroll system calculating salaries, use case diagrams clarify who does what, keeping projects on track.
In IT project visualization, use case diagrams act like a cheat sheet. They show users (like farmers or accountants) and their tasks (like checking soil data or processing payments). This clarity helps developers avoid building unnecessary features and ensures stakeholders agree on goals. By sketching these diagrams early, you catch issues before coding begins, saving time and headaches. They’re perfect for systems like soil monitoring, where user roles vary, or payroll, where accuracy is critical.
This blog is your guide to mastering use case diagrams. We’ll start by explaining their components in plain language, using the Soil Health Monitoring System as a key example. Next, we’ll walk through a sample diagram and share a PlantUML script to create your own. Finally, we’ll cover best practices to keep your diagrams clear and effective. Whether you’re new to system design or leveling up, this post will equip you to visualize IT projects with confidence. Let’s dive in and make project planning easier!
Understanding Use Case Diagrams for Soil Health Monitoring System
Use case diagrams are like a roadmap for IT systems, showing who uses them and what they do. They’re part of the Unified Modeling Language (UML), but don’t let that scare you—they’re super simple! For a Soil Health Monitoring System, they help visualize how users interact with features like soil testing or data reporting. In IT project development, they’re a go-to for clarifying requirements and keeping teams on the same page.
Here’s what’s in a use case diagram:
- Actors: The people or systems using the tool, drawn as stick figures. Think farmers or agronomists for soil monitoring.
- Use Cases: The tasks users perform, shown as ovals. Examples include “Measure Soil Nutrients” or “Generate Report.”
- System Boundary: A box around use cases, defining what’s part of the system.
UML basics make diagrams universal: actors connect to use cases with lines, showing interactions. You might see “include” (one task needs another) or “extend” (optional tasks), but keep these minimal for clarity.
Why use them? Use case diagrams shine early in projects. They:
- Clarify Needs: Show what users want, like farmers needing soil alerts.
- Boost Communication: Even non-tech folks can understand them.
- Define Scope: Focus on key features, avoiding bloat.
For a Soil Health Monitoring System, a diagram shows a farmer checking soil pH or an agronomist analyzing trends. This prevents missteps in system design. By mapping use case diagram components, IT students and developers can ensure their projects align with user goals, making these diagrams essential for IT project development.
Use Case Diagram: Soil Health Monitoring System Example
A Soil Health Monitoring System helps farmers and agronomists track soil conditions like nutrients, pH, and moisture to boost crop yields. It uses sensors for real-time data and offers reporting tools. A use case diagram clarifies how users interact with these features, ensuring the system meets their needs.
Key Actors:
- Farmer: Monitors soil and gets alerts.
- Agronomist: Analyzes data and creates reports.
- System Admin: Manages user accounts and settings.
Primary Use Cases:
- Measure Soil Nutrients: Farmer checks nutrient levels.
- View Soil Data: Farmer and Agronomist access real-time metrics.
- Generate Report: Agronomist creates data summaries.
- Receive Alerts: Farmer gets notifications for issues.
- Manage Users: Admin handles account access.
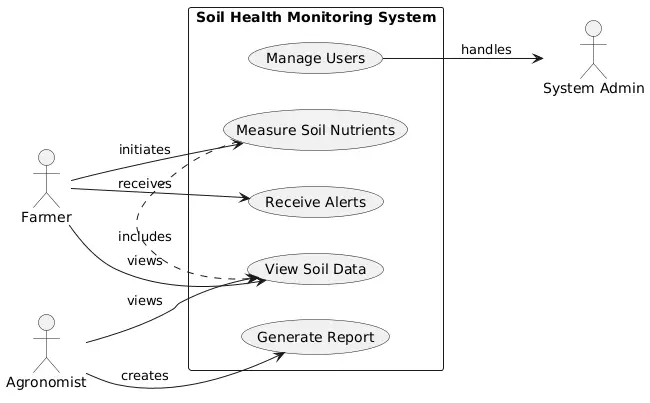
Diagram Description: Imagine a box labeled “Soil Health Monitoring System” (the system boundary). Inside are ovals for “Measure Soil Nutrients,” “View Soil Data,” “Generate Report,” “Receive Alerts,” and “Manage Users.” Outside, stick figures represent the Farmer, Agronomist, and Admin. Lines connect:
- Farmer to “Measure Soil Nutrients,” “View Soil Data,” and “Receive Alerts.”
- Agronomist to “View Soil Data” and “Generate Report.”
- Admin to “Manage Users.” The layout is clean, with no overlapping lines, making interactions clear.
Real-World Application: In a farming cooperative, this Soil Health Monitoring System use case diagram guides developers. For example, “Receive Alerts” ensures farmers get timely warnings about low nutrients, improving crops. The diagram helps stakeholders agree on features, streamlining development. For IT students, practicing this use case example builds skills in IT project visualization, ensuring systems are user-focused and efficient.
PlantUML Script for Soil Health Monitoring System Use Case Diagram
Below is a PlantUML script for a use case diagram of a Soil Health Monitoring System. It’s vertically aligned to keep lines from intersecting, making it clear and beginner-friendly.
@startuml
left to right direction

actor "Farmer" as F
actor "Agronomist" as A
actor "System Admin" as SA

rectangle "Soil Health Monitoring System" {
usecase "Measure Soil Nutrients" as UC1
usecase "View Soil Data" as UC2
usecase "Generate Report" as UC3
usecase "Receive Alerts" as UC4
usecase "Manage Users" as UC5
}

' Connect left-side actors
F --> UC1 : initiates
F --> UC2 : views
F --> UC4 : receives

A --> UC2 : views
A --> UC3 : creates

' Move SA to right side
UC5 --> SA : handles

' Use include relationship
UC1 .> UC2 : includes

@enduml
This PlantUML use case diagram script maps a Soil Health Monitoring System. Actors (Farmer, Agronomist, System Admin) connect to use cases like “Measure Soil Nutrients” and “Generate Report” within the system boundary. The “includes” relationship shows measuring nutrients feeds into viewing data. The top-to-bottom layout ensures no lines cross, enhancing clarity. Labels like “initiates” and “views” define interactions. This IT project tool helps IT students and developers visualize user needs, ensuring the Soil Health Monitoring System diagram aligns with project goals. Paste this into a PlantUML editor to see the diagram!
The script is designed for simplicity, using clear PlantUML notation. The vertical alignment (top to bottom) organizes actors on the left and use cases on the right, preventing clutter. The “includes” relationship adds depth without complexity, showing how measuring nutrients is part of viewing data. This Soil Health Monitoring System diagram is a practical example for IT project tools, helping beginners create professional diagrams with ease.
Best Practices for Creating Use Case Diagrams
Crafting clear use case diagrams is crucial for IT project planning. These tips will help IT students and developers make diagrams that shine for systems like the Soil Health Monitoring System or payroll.
Tips for Clarity and Simplicity:
- Choose Clear Names: Use action-oriented names like “Measure Soil Nutrients,” not vague ones like “Process Data.”
- Focus on Users: Include only user-driven tasks, like “Receive Alerts” for farmers, not backend processes.
- Keep It Simple: Stick to 5-10 use cases to avoid clutter. Skip minor tasks like “Save Data.”
- Check with Users: Share the diagram with stakeholders (e.g., agronomists) to ensure it fits their needs.
- Use Tools: Tools like Lucidchart, Draw.io, or PlantUML make diagrams professional and easy to edit.
Common Mistakes to Avoid:
- Overloading Diagrams: Too many use cases or actors, like including every farm worker, confuses readers.
- Vague Connections: Label interactions clearly, like “views” for viewing soil data.
- Missing Key Actors: Don’t skip roles like System Admin, who manages access.
- Ignoring Scope: Keep use cases within the system boundary, excluding external tasks.
Tools like PlantUML are perfect for beginners, offering simple scripting for clean layouts. For a Soil Health Monitoring System, a diagram following these use case diagram best practices ensures developers prioritize features like real-time alerts. Always validate your diagram against project requirements to catch gaps early. With these tips, you’ll create diagrams that boost IT project planning and keep teams aligned.
Conclusion
Use case diagrams are a game-changer for IT project success, making systems like the Soil Health Monitoring System or payroll easy to plan. They map user interactions, helping IT students and developers clarify requirements and build user-focused solutions. Our Soil Health Monitoring System example showed how farmers, agronomists, and admins use features like soil alerts and reports. The PlantUML script and best practices shared here make it simple to create your own diagrams, ensuring clarity and focus in system design visualization.
Ready to give it a try? Grab Draw.io or PlantUML and sketch a diagram for your next project. Practicing will boost your confidence in IT project planning. We’d love to hear from you! Comment with systems you’d like us to diagram, like payroll or e-commerce, or ask for tips to customize your diagrams. Your feedback shapes future posts to help you excel in IT project success. Let’s keep the conversation going and make system design fun and approachable!
You may visit our Facebook page for more information, inquiries, and comments. Please subscribe also to our YouTube Channel to receive free capstone projects resources and computer programming tutorials.
Hire our team to do the project.